Free Access
Fig. 1
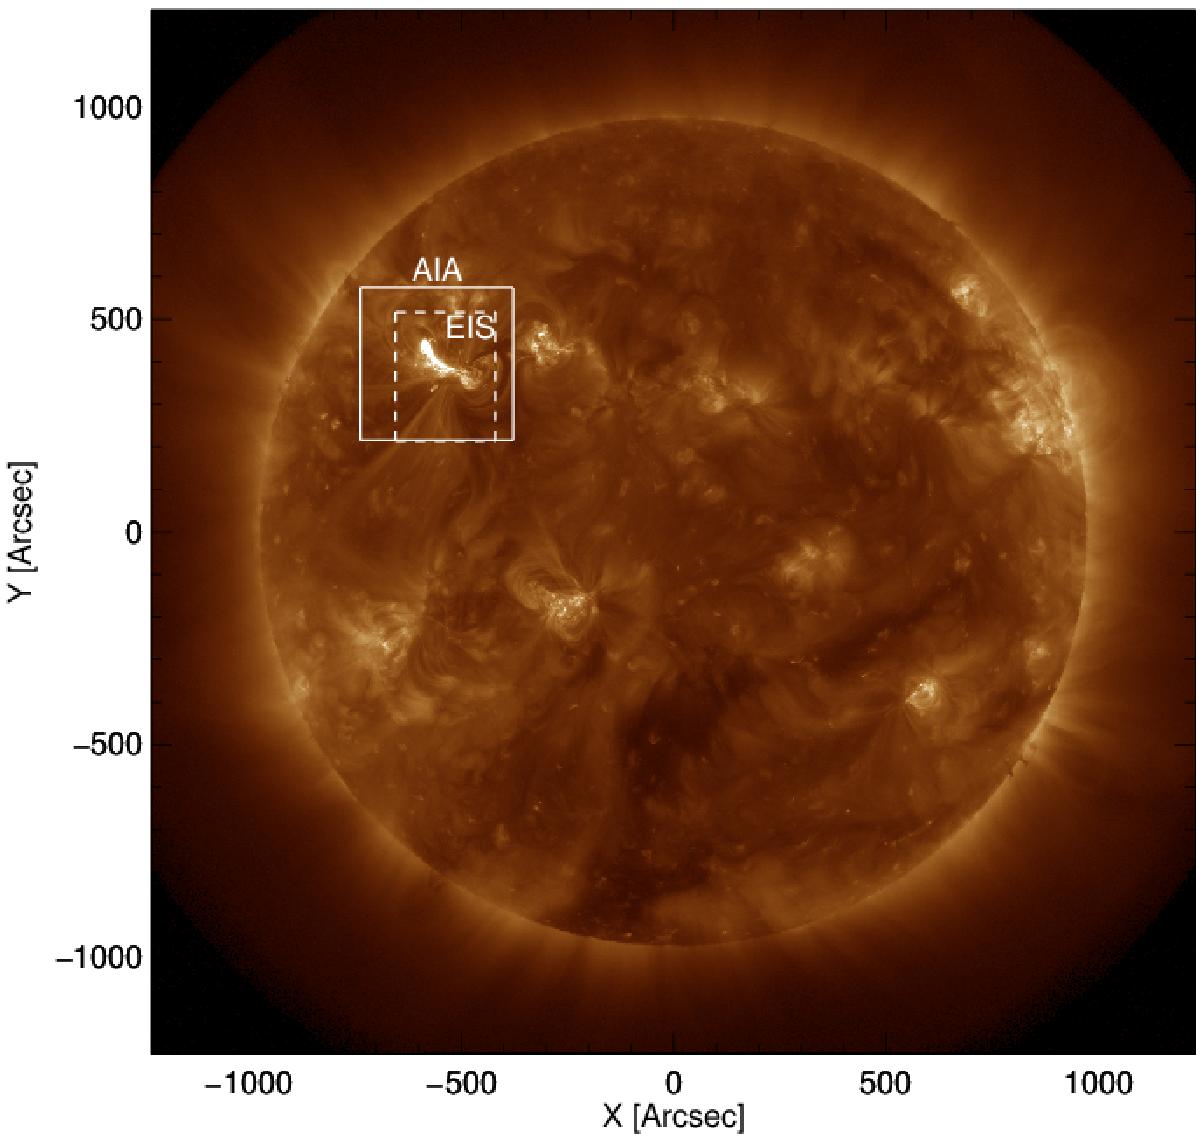
Full disk AIA 94 Å image on March 6, 2012, 13:25 UT. The solid lines box outlines the FoV of the AIA cutouts used in this studym and the dashed lines box indicates the FoV of the EIS rasters.
Current usage metrics show cumulative count of Article Views (full-text article views including HTML views, PDF and ePub downloads, according to the available data) and Abstracts Views on Vision4Press platform.
Data correspond to usage on the plateform after 2015. The current usage metrics is available 48-96 hours after online publication and is updated daily on week days.
Initial download of the metrics may take a while.