Fig. B.1
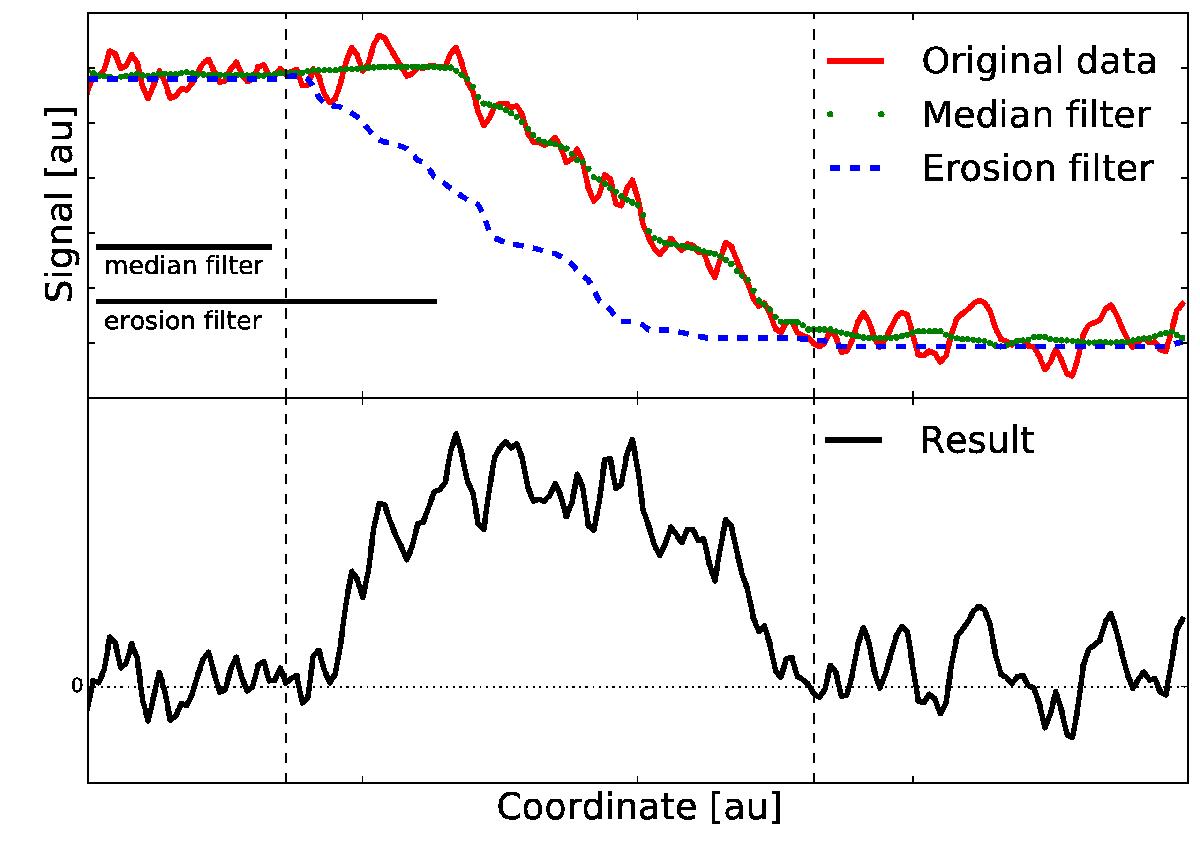
Demonstration of the minimum masking on a one-dimensional example. Upper panel: the original data (red) are first smoothed by the median filter (green). Then the erosion (minimum) filter is applied (blue). Lower panel: the result is obtained as the difference between the original and the filtered data (the red and blue curve, respectively). The widths of the median and erosion filters are indicated in the figure. The unit au means arbitrary unit. The original (red curve) is a step-like transition between two constant values with added noise. The resulting signal (black curve) oscillates around zero outside the area indicated by the vertical lines. The width of this area is determined by the width of the transition in the original signal and the chosen width of the filter. The original step transforms into a bump.
Current usage metrics show cumulative count of Article Views (full-text article views including HTML views, PDF and ePub downloads, according to the available data) and Abstracts Views on Vision4Press platform.
Data correspond to usage on the plateform after 2015. The current usage metrics is available 48-96 hours after online publication and is updated daily on week days.
Initial download of the metrics may take a while.