Fig. A.1
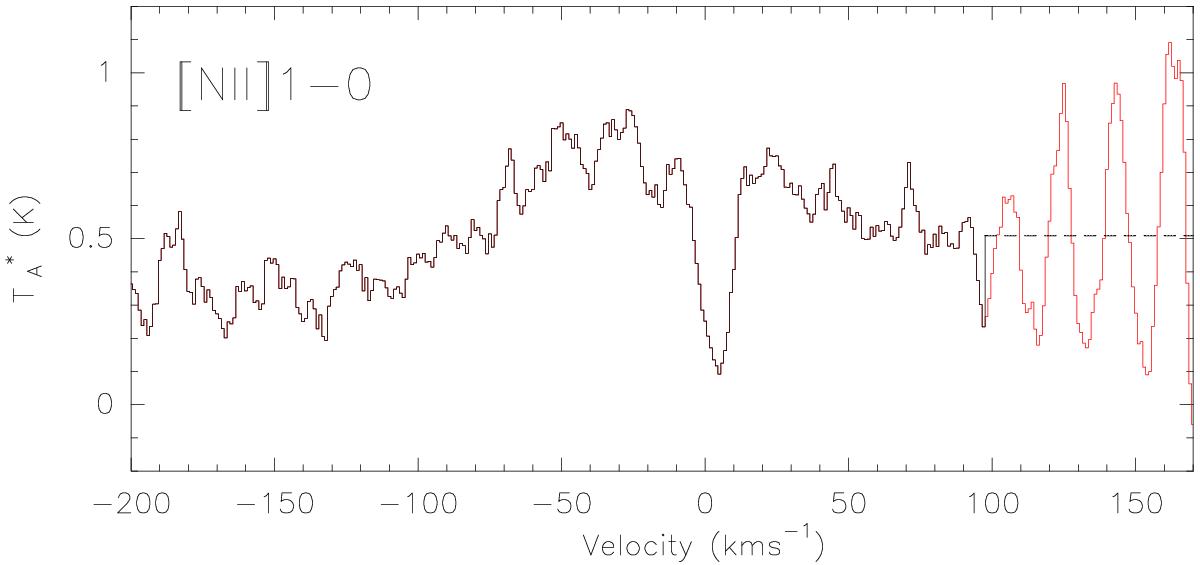
[NII] average spectrum of the V polarization observations over the whole map. The red line indicates the distortion of the baseline between +94 km s-1 and +170 km s-1 present in all the spectra. The dashed line over the same LSR velocity interval shows the result of the method utilized in getting rid of the distortion by replacing the measured antenna temperatures by their average value within the same LSR velocity interval.
Current usage metrics show cumulative count of Article Views (full-text article views including HTML views, PDF and ePub downloads, according to the available data) and Abstracts Views on Vision4Press platform.
Data correspond to usage on the plateform after 2015. The current usage metrics is available 48-96 hours after online publication and is updated daily on week days.
Initial download of the metrics may take a while.