Fig. 20
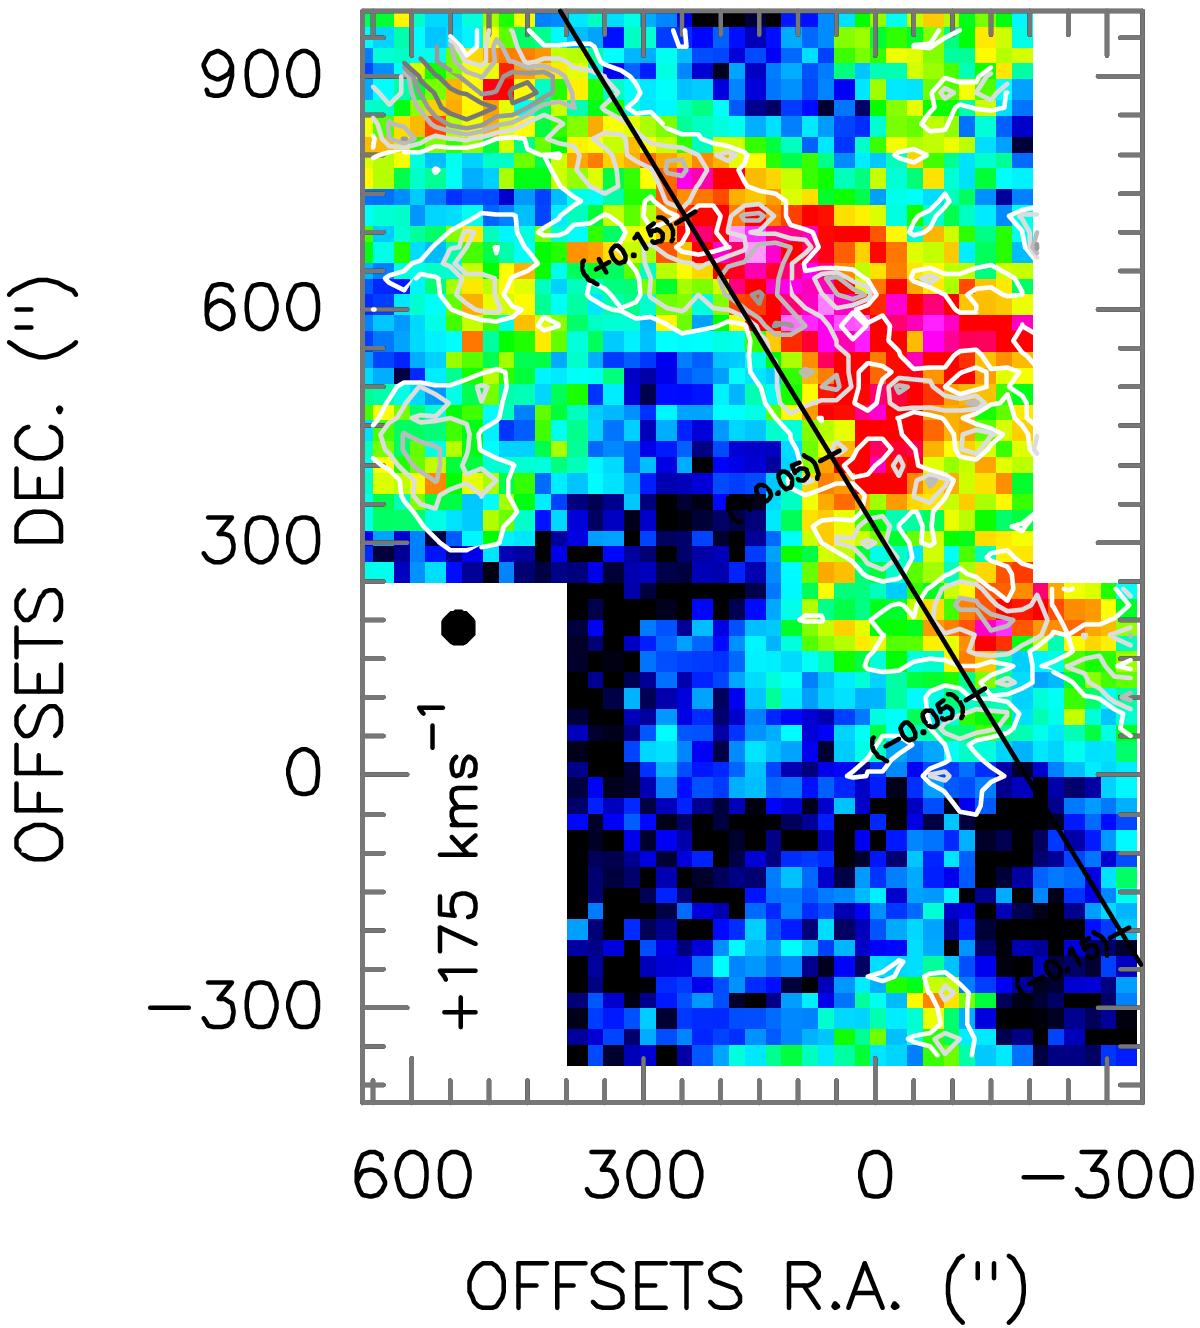
Channel map of the [CI](1−0) (colour scale) and CO(4−3) (contours, black is the largest value) emission of the high velocity gas component at +175 km s-1. The filled black circle shows the 46′′ angular resolution of the [CI](1−0) data. The solid straight line shows the position of the Galactic plane at b = 0°, with marks denoting a few Galactic longitude values for orientation. The structure belongs to the X1 orbits in the gravitational potential of the GC. The emission from both lines show large spatial coincidence, though intensity ratios can have large variations, especially towards the CO(4−3) peak, at the upper left corner of the image.
Current usage metrics show cumulative count of Article Views (full-text article views including HTML views, PDF and ePub downloads, according to the available data) and Abstracts Views on Vision4Press platform.
Data correspond to usage on the plateform after 2015. The current usage metrics is available 48-96 hours after online publication and is updated daily on week days.
Initial download of the metrics may take a while.