Fig. 2
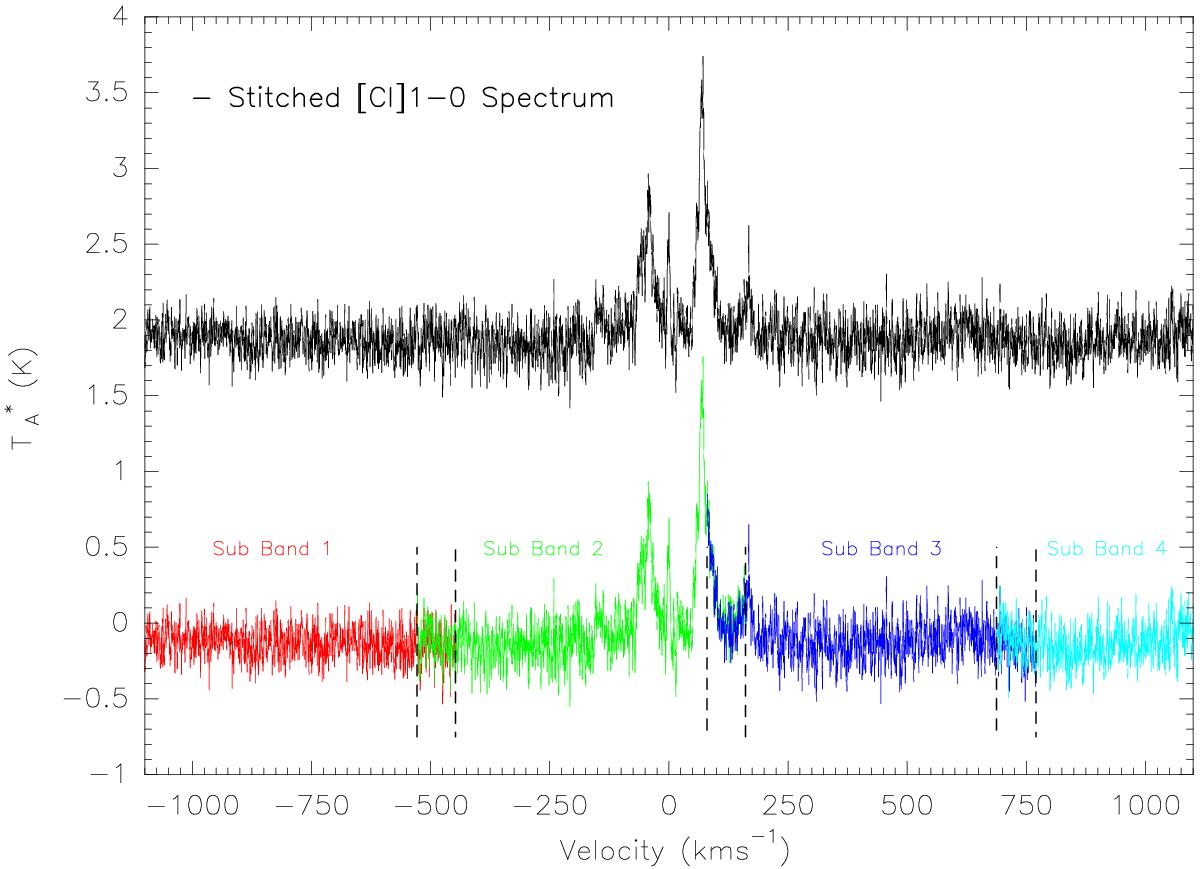
[CI](1−0) spectrum showing the 1 GHz WBS sub-bands before (colours) and after (black) the stitching procedure. The dashed vertical lines encompass the overlapping spectral region between consecutive sub-bands. After the stitching procedure, the full spectrum is used in the data reduction process. The displacement in the continuum level towards higher antenna temperatures of the end product spectrum is artificially introduced for display purposes
Current usage metrics show cumulative count of Article Views (full-text article views including HTML views, PDF and ePub downloads, according to the available data) and Abstracts Views on Vision4Press platform.
Data correspond to usage on the plateform after 2015. The current usage metrics is available 48-96 hours after online publication and is updated daily on week days.
Initial download of the metrics may take a while.