Fig. 17

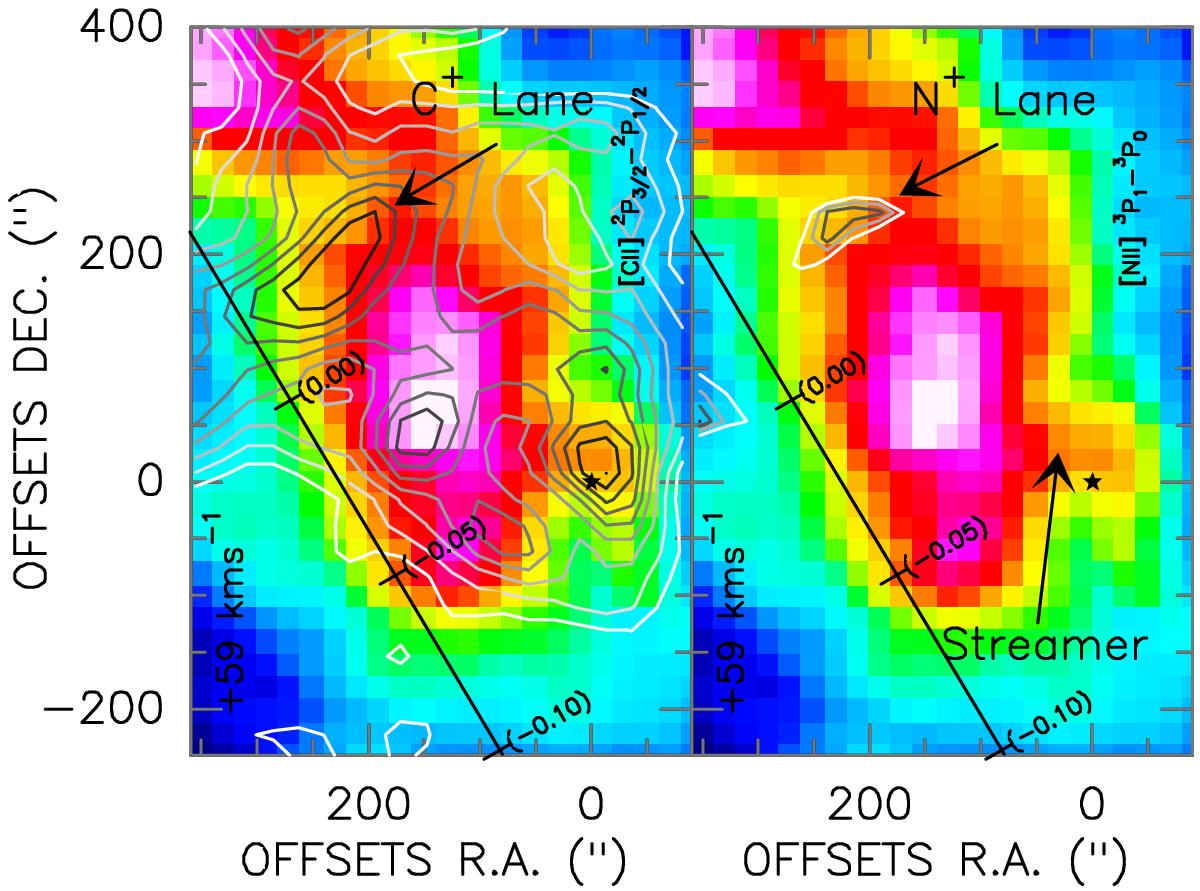
Integrated intensity map (3 km s-1 wide) of the CO(4−3) (colour scale) from the +50 km s-1 cloud centred at +58 km s-1 with [CII] (left) and [NII] (right) emission as contours overlaid on the maps. The first contour of the high frequency lines is set at a 5 × σ significance level, with σ the typical noise of the map. The ⋆ symbol represents the position of Sgr A⋆. The solid straight line shows the position of the Galactic plane at ![]() , with marks denoting a few Galactic longitude values for orientation. A prominent [CII] structure is found tangent to the convex side of the +50 km s-1 cloud with a small [NII] counterpart.
, with marks denoting a few Galactic longitude values for orientation. A prominent [CII] structure is found tangent to the convex side of the +50 km s-1 cloud with a small [NII] counterpart.
Current usage metrics show cumulative count of Article Views (full-text article views including HTML views, PDF and ePub downloads, according to the available data) and Abstracts Views on Vision4Press platform.
Data correspond to usage on the plateform after 2015. The current usage metrics is available 48-96 hours after online publication and is updated daily on week days.
Initial download of the metrics may take a while.


