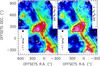
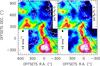
Fig. 14

Channel maps at −11 km s-1 (top panels) and +8 km s-1 (bottom panels) of the CO(4−3) (colour scale) emission, while the [CI](1−0) (left panels) and [CI](2−1) (right panels) lines are shown as contours. Open circles show the spatial resolution of the carbon lines, while the black filled circles show the spatial resolution of the carbon monoxide line. The ⋆ symbol shows the position of Sgr A⋆. The colour scale is the same in all panels. The solid straight line shows the position of the Galactic plane at b = 0°; the marks denote a few Galactic longitude values for orientation.
Current usage metrics show cumulative count of Article Views (full-text article views including HTML views, PDF and ePub downloads, according to the available data) and Abstracts Views on Vision4Press platform.
Data correspond to usage on the plateform after 2015. The current usage metrics is available 48-96 hours after online publication and is updated daily on week days.
Initial download of the metrics may take a while.