Fig. 13
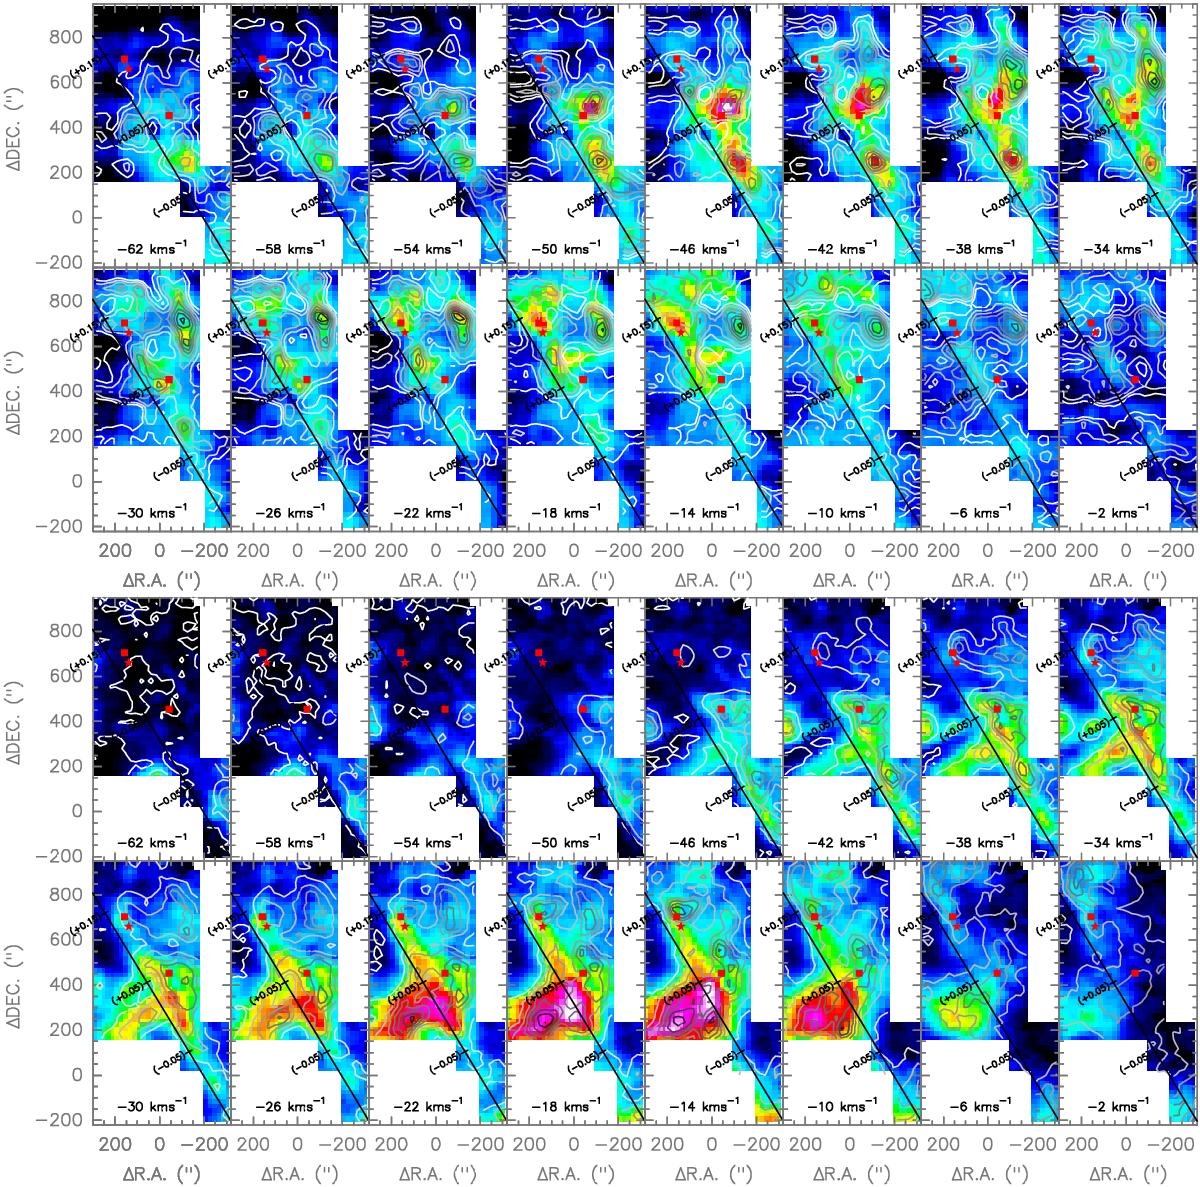
Integrated intensity maps (5 km s-1 wide) of the [CII] (colour scale) and [NII] (contours) lines in the top panels and of the CO(4−3) (colour scale) and [CI](1−0) (contours) lines in the bottom panels, tracing the molecular and atomic material towards the Arched Filaments E1, E2, W1, and W2 and the H Region as shown in Fig. 12. The red star shows the location of the Arches Cluster, while red squares show the positions of two CS(2−1) peaks shown in the work by Serabyn & Guesten (1987), tracing high density material. The solid straight line shows the position of the Galactic plane at b = 0°, with marks denoting a few Galactic longitude values for orientation. The central LSR velocity of the maps is shown in each panel.
Current usage metrics show cumulative count of Article Views (full-text article views including HTML views, PDF and ePub downloads, according to the available data) and Abstracts Views on Vision4Press platform.
Data correspond to usage on the plateform after 2015. The current usage metrics is available 48-96 hours after online publication and is updated daily on week days.
Initial download of the metrics may take a while.