Fig. 11
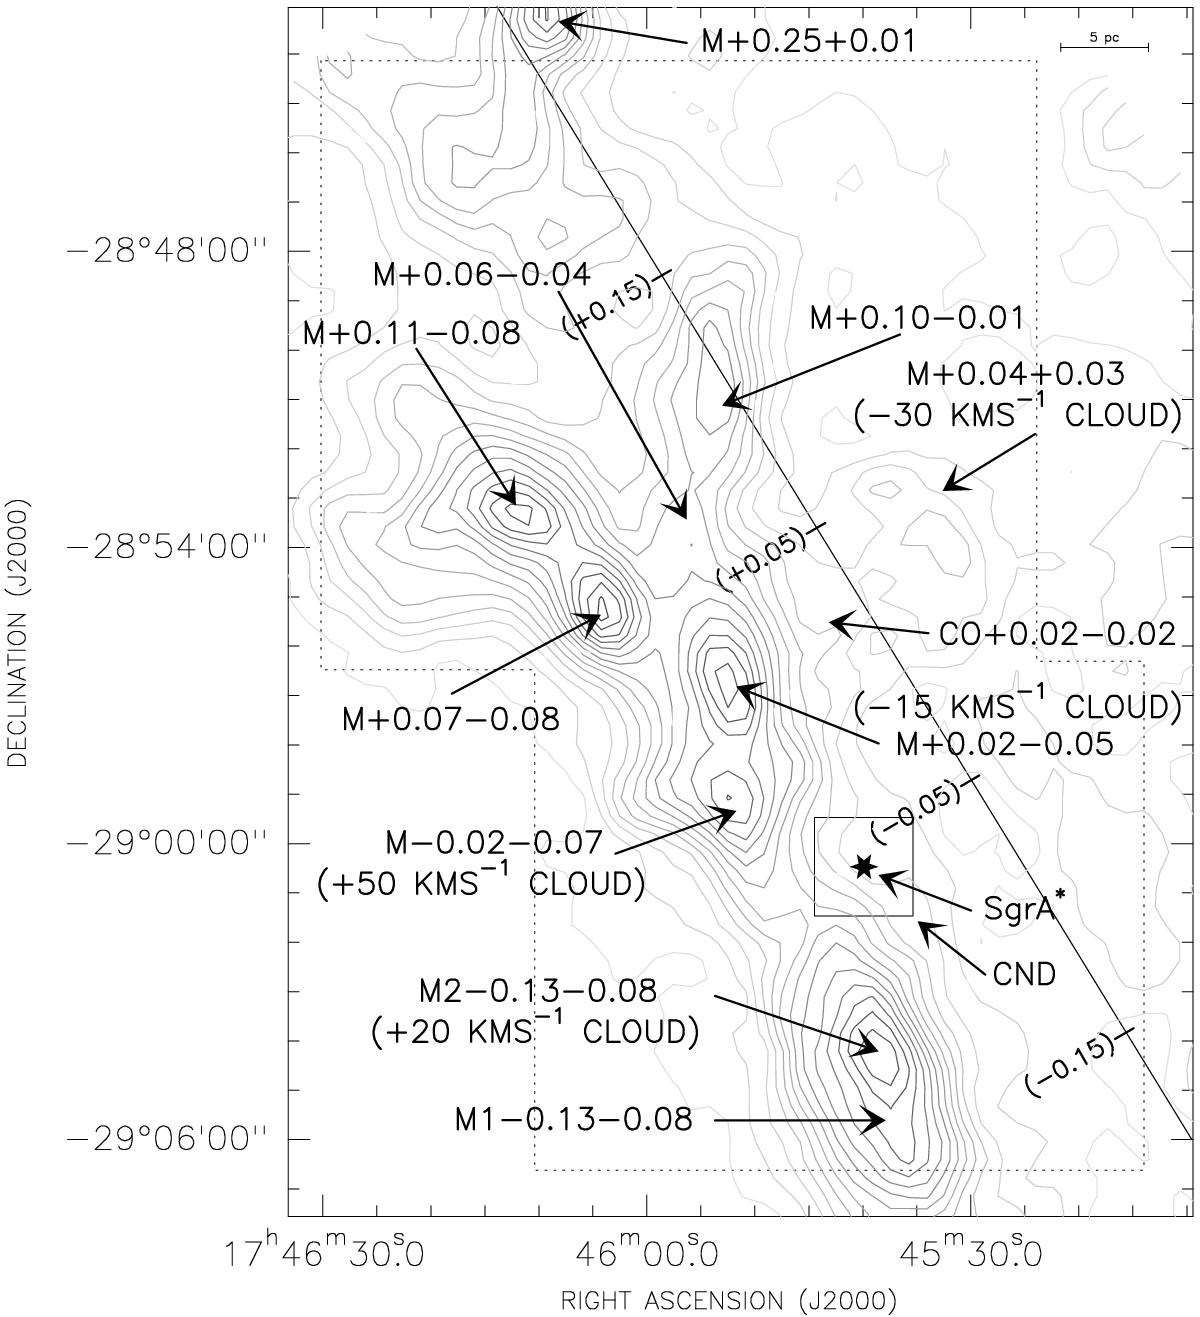
N2H+(1−0) (diazenylium) integrated intensity map between −75 and +110 km s-1of the Mopra observations by Jones et al. (2012). The spatial resolution of the map is 44′′ with 3.6 km s-1 spectral resolution. The first contour is located at ~1 K km s-1 , equivalent to 5 × σ with σ the typical noise of the map. The contour increment is 5 K km s-1. The solid straight line shows the position of the Galactic plane at b = 0°; the marks denote a few Galactic longitude values for orientation. The area is covered by the Herschel-HIFI observations.
Current usage metrics show cumulative count of Article Views (full-text article views including HTML views, PDF and ePub downloads, according to the available data) and Abstracts Views on Vision4Press platform.
Data correspond to usage on the plateform after 2015. The current usage metrics is available 48-96 hours after online publication and is updated daily on week days.
Initial download of the metrics may take a while.