Fig. 10
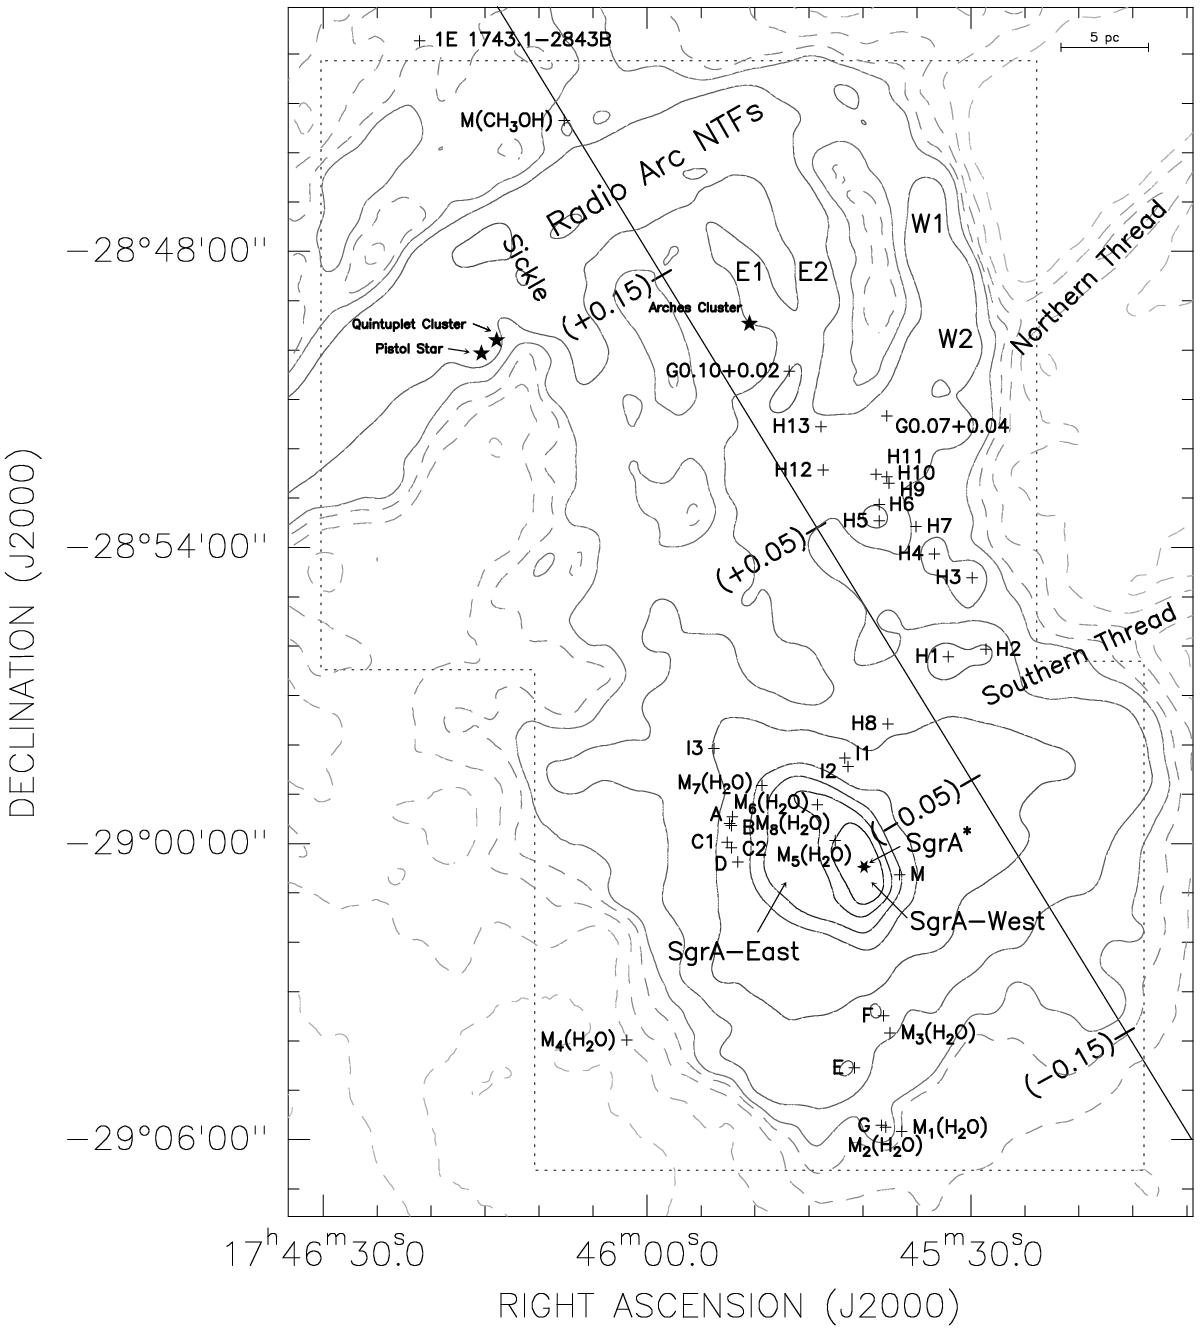
20 cm continuum observations at 30′′ spatial resolution from Yusef-Zadeh & Morris (1987a). Overplotted on the figure are several discrete sources found in the literature (see Sect. 3). Following Lang et al. (2010), contours levels are at 10, 15, 20, 25, 30, 35, 50, 100, 300, 500, 700, and 900 times 8.5 mJy beam-1. The solid straight line shows the position of the Galactic plane at b = 0°, with marks denoting a few Galactic longitude values for orientation. The dotted line shows the area covered by the Herschel-HIFI observations.
Current usage metrics show cumulative count of Article Views (full-text article views including HTML views, PDF and ePub downloads, according to the available data) and Abstracts Views on Vision4Press platform.
Data correspond to usage on the plateform after 2015. The current usage metrics is available 48-96 hours after online publication and is updated daily on week days.
Initial download of the metrics may take a while.