Fig. 4
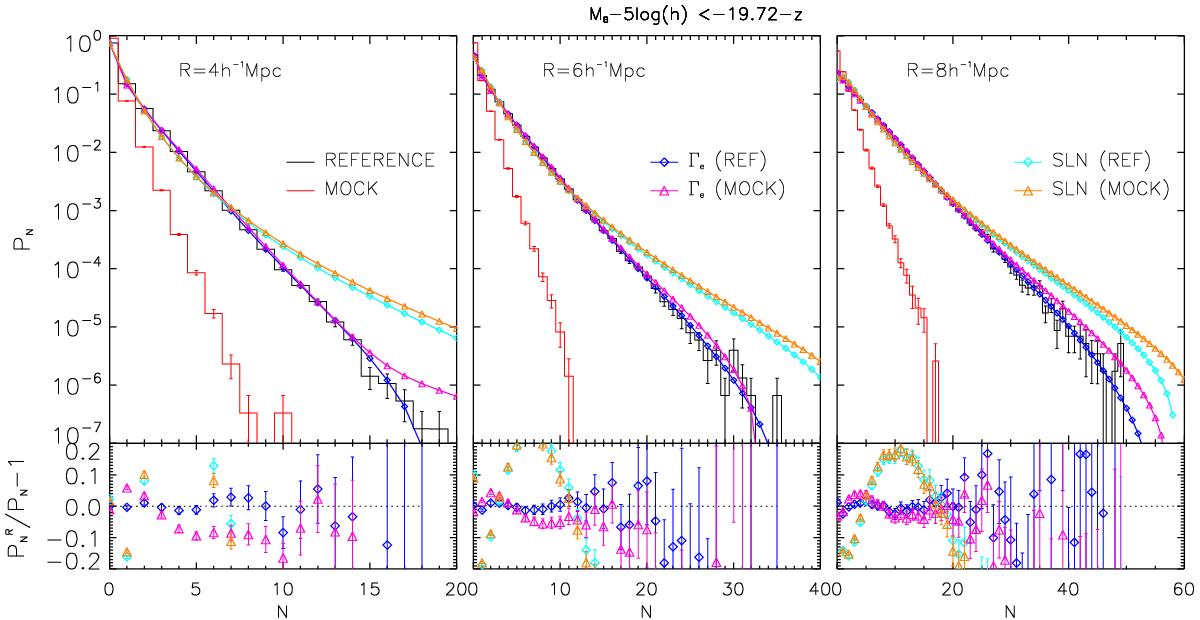
Comparison between the SLN and Γe methods at 0.9 <z< 1.1. Each panel corresponds to a cell radius R of 4, 6, and 8 h-1 Mpc from left to right. Top: the red histogram shows the observed PDF in the MOCK catalogues while the black histogram displays the PDF extracted from the REFERENCE catalogues. The blue diamonds with lines and the magenta triangles each show the Γe expansion performed in the REFERENCE and MOCK catalogues, respectively. On the other hand, the cyan diamonds with lines and the orange triangles show, respectively, the SLN expansion performed in the REFERENCE and MOCK catalogues. Bottom: relative deviation of the Γe and SLN expansions applied to both the REFERENCE and MOCK catalogues with respect to the PDF of the REFERENCE catalogues.
Current usage metrics show cumulative count of Article Views (full-text article views including HTML views, PDF and ePub downloads, according to the available data) and Abstracts Views on Vision4Press platform.
Data correspond to usage on the plateform after 2015. The current usage metrics is available 48-96 hours after online publication and is updated daily on week days.
Initial download of the metrics may take a while.