Fig. 2
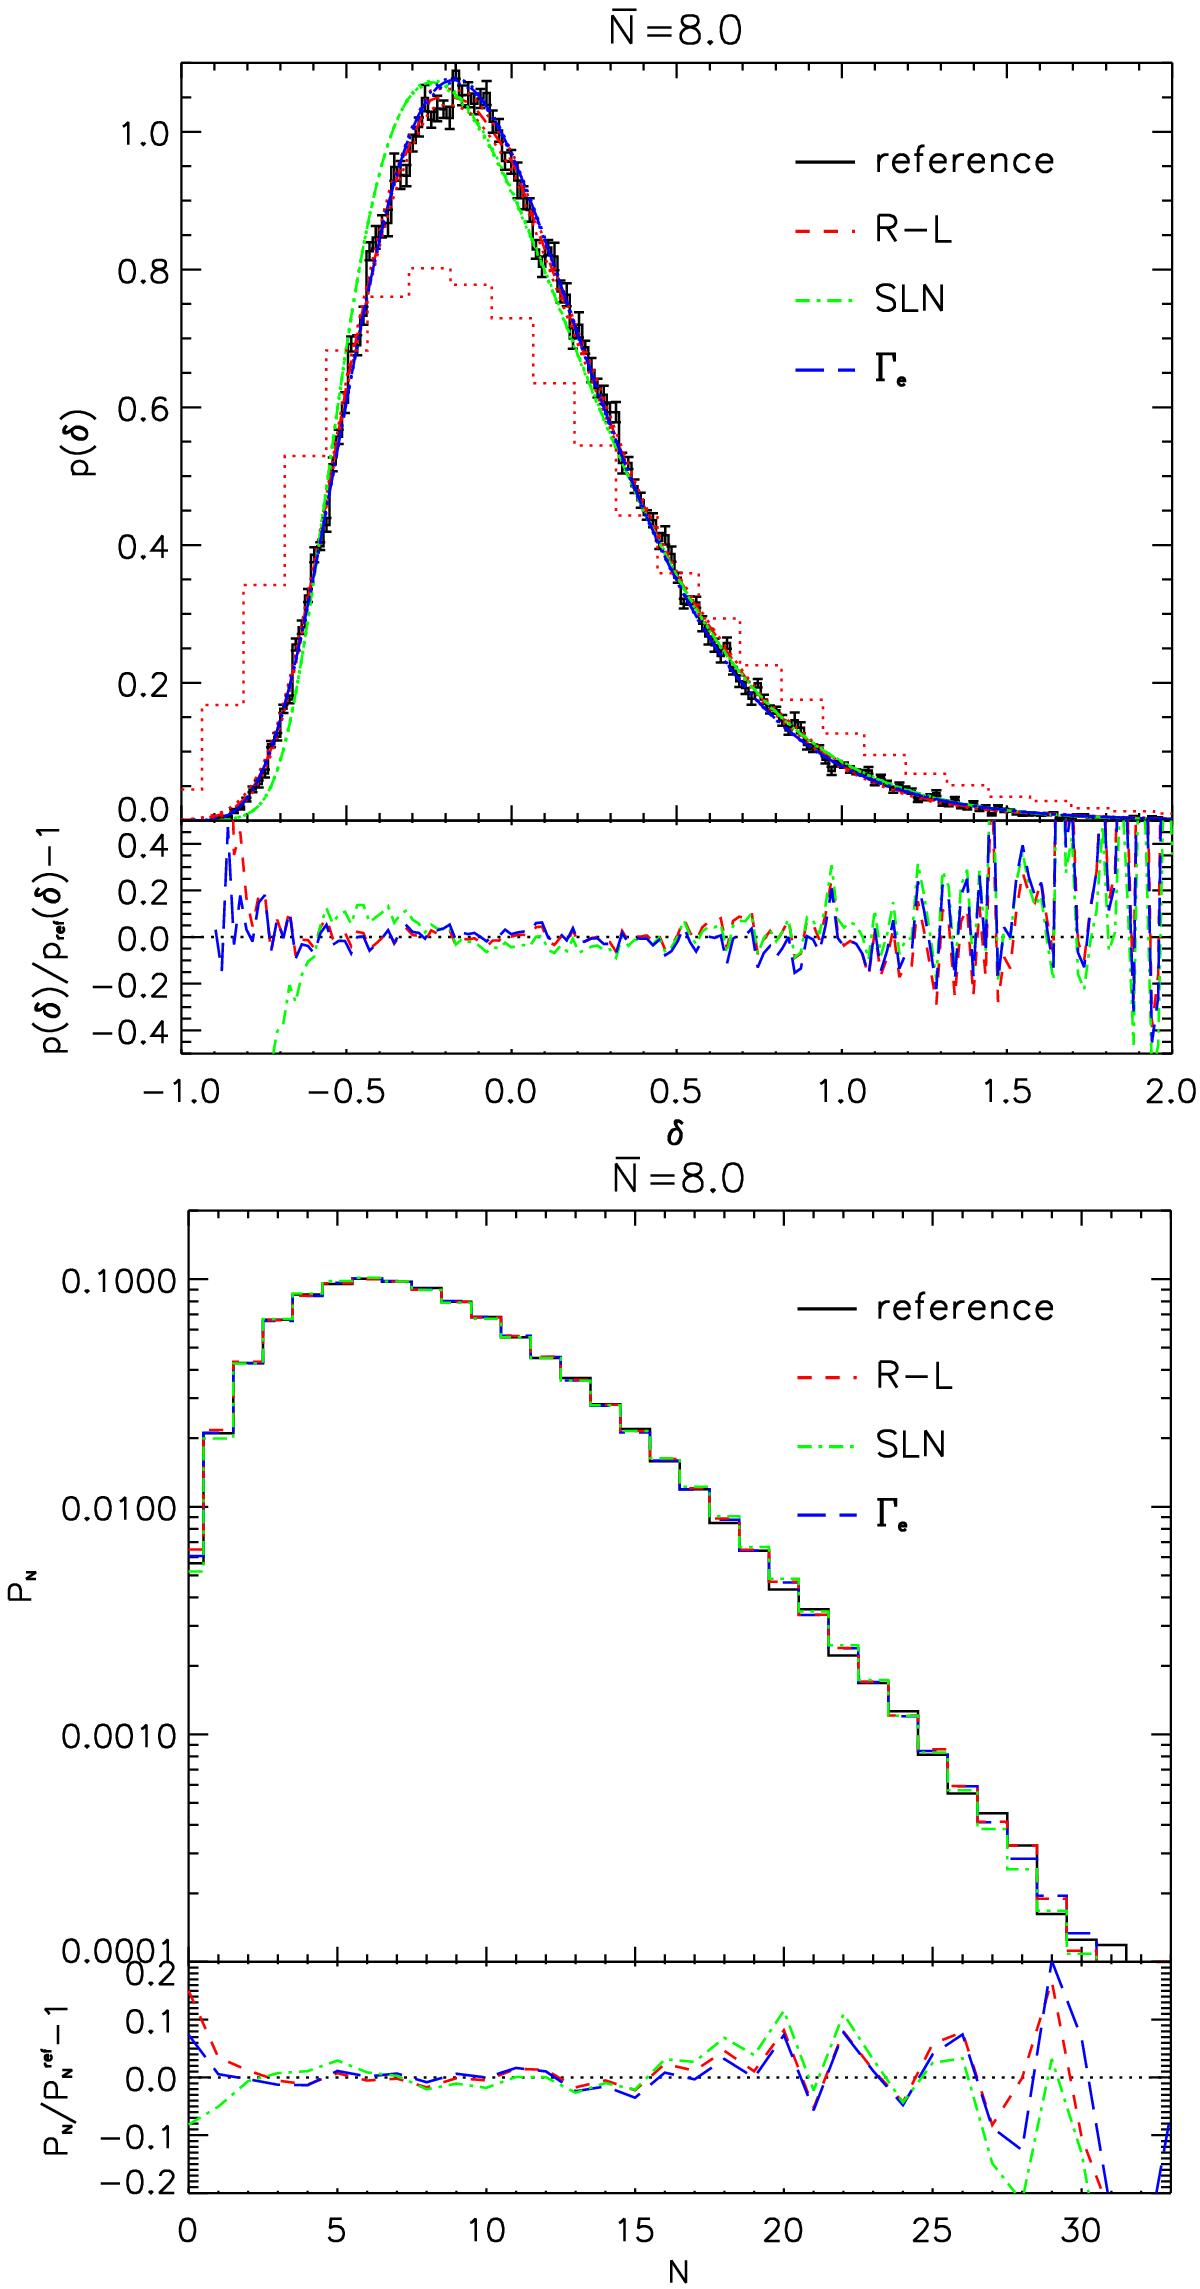
Upper: black histogram with error bars showing the true underlying probability-density function (referred to as reference in the inset) compared to the reconstruction obtained with the R-L (red dashed line), the SLN (green dot-dashed line), and the Γe (blue long dashed line) methods. The red dotted histogram shows the PDF used as the initial guess for the R-L method and the coloured dotted lines around each method line represent the dispersion of the reconstruction among the 20 fake galaxy catalogues. We also display the relative difference of the result obtained from each method with respect to the true PDF. Lower: the black histogram with error bars shows the observed probability-density function (referred to as reference in the inset) compared to the reconstruction obtained with the R-L (red dashed line), the SLN (green dot-dashed line), and the Γe (blue long dashed line) methods. We also display the relative difference in the result obtained from each method with respect to the observed PN.
Current usage metrics show cumulative count of Article Views (full-text article views including HTML views, PDF and ePub downloads, according to the available data) and Abstracts Views on Vision4Press platform.
Data correspond to usage on the plateform after 2015. The current usage metrics is available 48-96 hours after online publication and is updated daily on week days.
Initial download of the metrics may take a while.