Fig. C.1
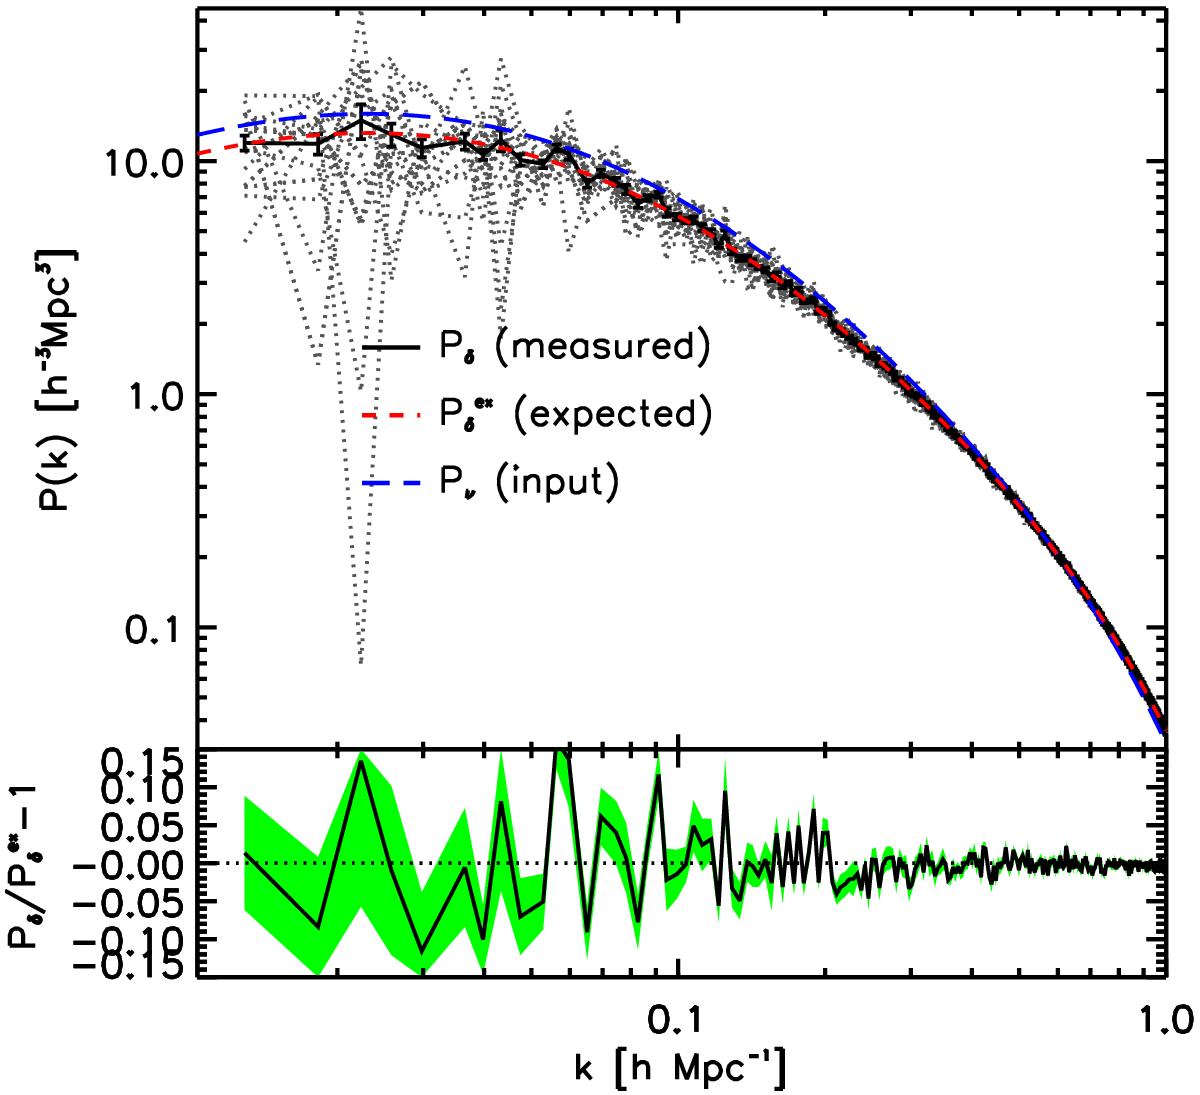
Upper: grey dotted lines show the power spectrum measured in each of the 20 fake galaxy distributions, the black solid line represent their average and the errors display the dispersion of the measurements. The blue long dashed line displays the input power spectrum used too generate the Gaussian stochastic field nu and the red dashed line shows the corresponding expectation value for the power spectrum of the density contrast δ. Lower: shows the deviation between the measured power spectrum of the δ-field and the expected one.
Current usage metrics show cumulative count of Article Views (full-text article views including HTML views, PDF and ePub downloads, according to the available data) and Abstracts Views on Vision4Press platform.
Data correspond to usage on the plateform after 2015. The current usage metrics is available 48-96 hours after online publication and is updated daily on week days.
Initial download of the metrics may take a while.