Free Access
Fig. 10
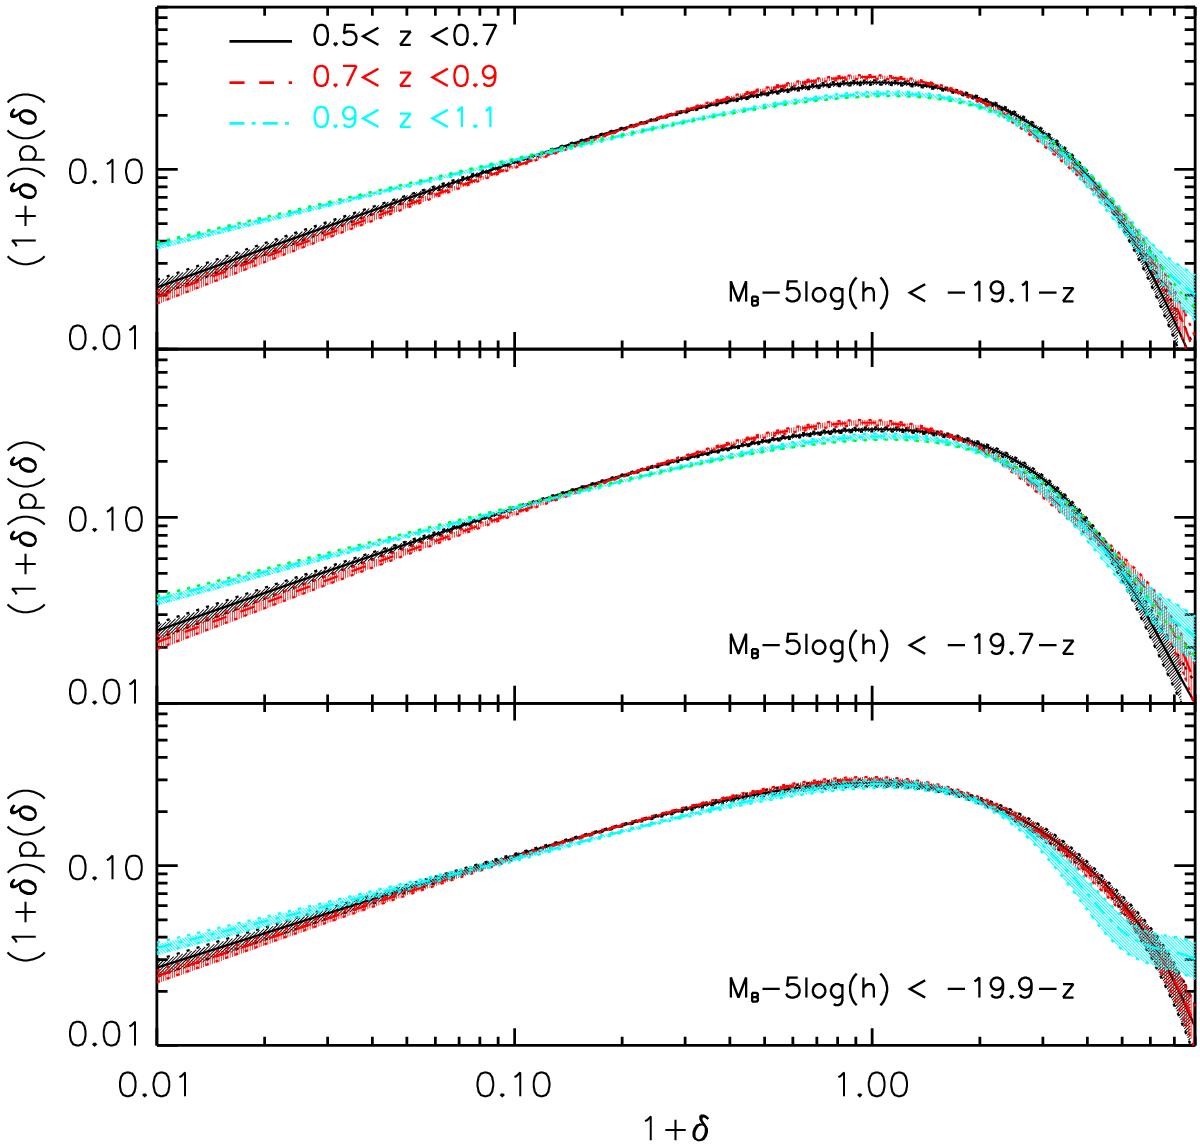
Evolution of three galaxy populations, selected according to their luminosity (from bottom to top). On each panel, the black solid, red dashed, and cyan dot-dashed lines represent, respectively, the three redshift bins 0.5 <z< 0.7, 0.7 <z< 0.9, and, 0.9 <z< 1.1.
Current usage metrics show cumulative count of Article Views (full-text article views including HTML views, PDF and ePub downloads, according to the available data) and Abstracts Views on Vision4Press platform.
Data correspond to usage on the plateform after 2015. The current usage metrics is available 48-96 hours after online publication and is updated daily on week days.
Initial download of the metrics may take a while.