Fig. 1
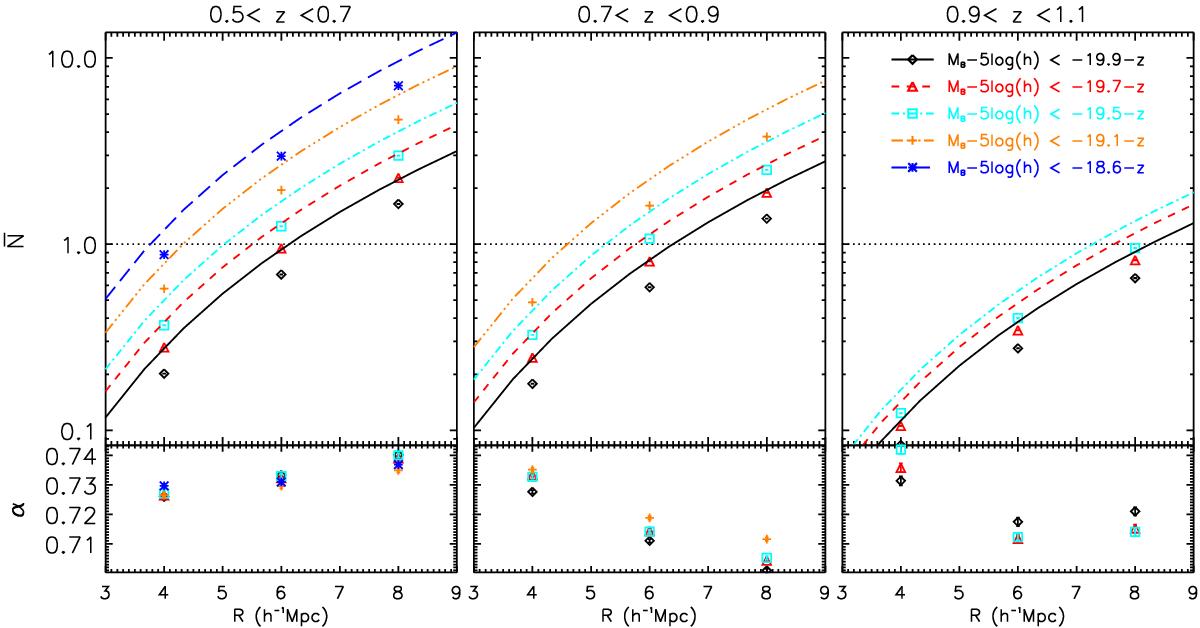
Upper: expected mean number count in spheres (solid line, from Eq. (2)) with respect to the observed one (symbols) for the various luminosity cuts and for the three redshift bins [ 0.5,0.7 ] (left panel), [ 0.7,0.9 ] (central panel), and [ 0.9,1.1 ] (right panel). The selection in absolute magnitude MB in B-band, corresponding to each symbols/lines and colors, are indicated in the inset. The dotted line displays the ![]() . Lower: deviation α (see Eq. (3)) between the expected mean number
. Lower: deviation α (see Eq. (3)) between the expected mean number ![]() and the observed one
and the observed one ![]() with respect to the radius R of the cells.
with respect to the radius R of the cells.
Current usage metrics show cumulative count of Article Views (full-text article views including HTML views, PDF and ePub downloads, according to the available data) and Abstracts Views on Vision4Press platform.
Data correspond to usage on the plateform after 2015. The current usage metrics is available 48-96 hours after online publication and is updated daily on week days.
Initial download of the metrics may take a while.