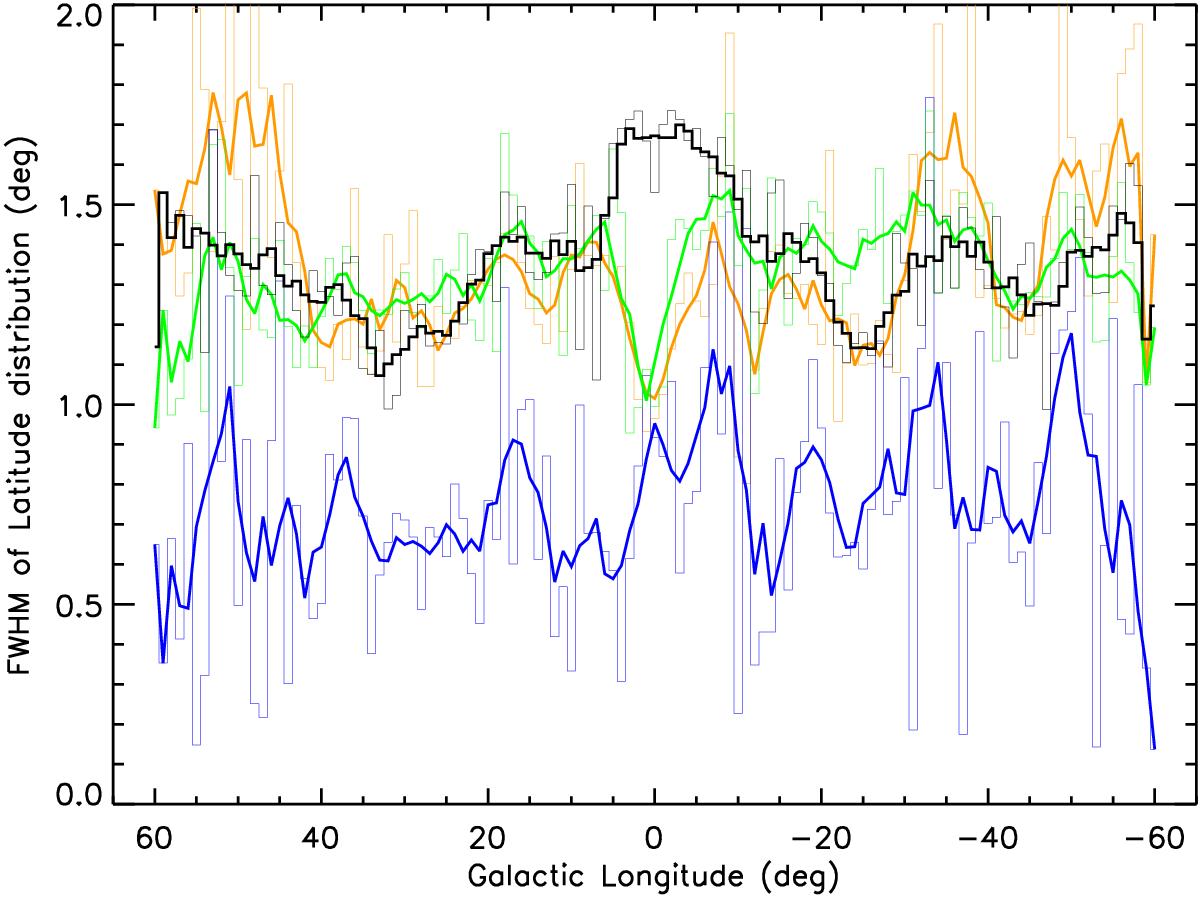
Fig. 6

Distribution as a function of longitude of the full width at half maximum of the latitude distribution of various quantities described in the text, averaged in 1° longitude bins. The Hi-GAL 70-μm and 250-μm compact sources belonging to the band-merged source list are indicated with a full line blue and green histograms, where the FWHMs have been determined by a Gaussian fit to the source latitude distribution in each longitude bin. The black histogram represents the distribution of the MIPSGAL 24-μm sources, computed in the same way as for the Hi-GAL sources. The orange histogram represents the FWHM of the Hi-GAL 500-μm diffuse emission obtained simply as the amplitude of the latitude band encompassed by the 50% levels in Fig. 3. For each histogram, the thick lines of the same respective colour show the distributions after smoothing with a 5°-wide boxcar.
Current usage metrics show cumulative count of Article Views (full-text article views including HTML views, PDF and ePub downloads, according to the available data) and Abstracts Views on Vision4Press platform.
Data correspond to usage on the plateform after 2015. The current usage metrics is available 48-96 hours after online publication and is updated daily on week days.
Initial download of the metrics may take a while.


