Fig. 5
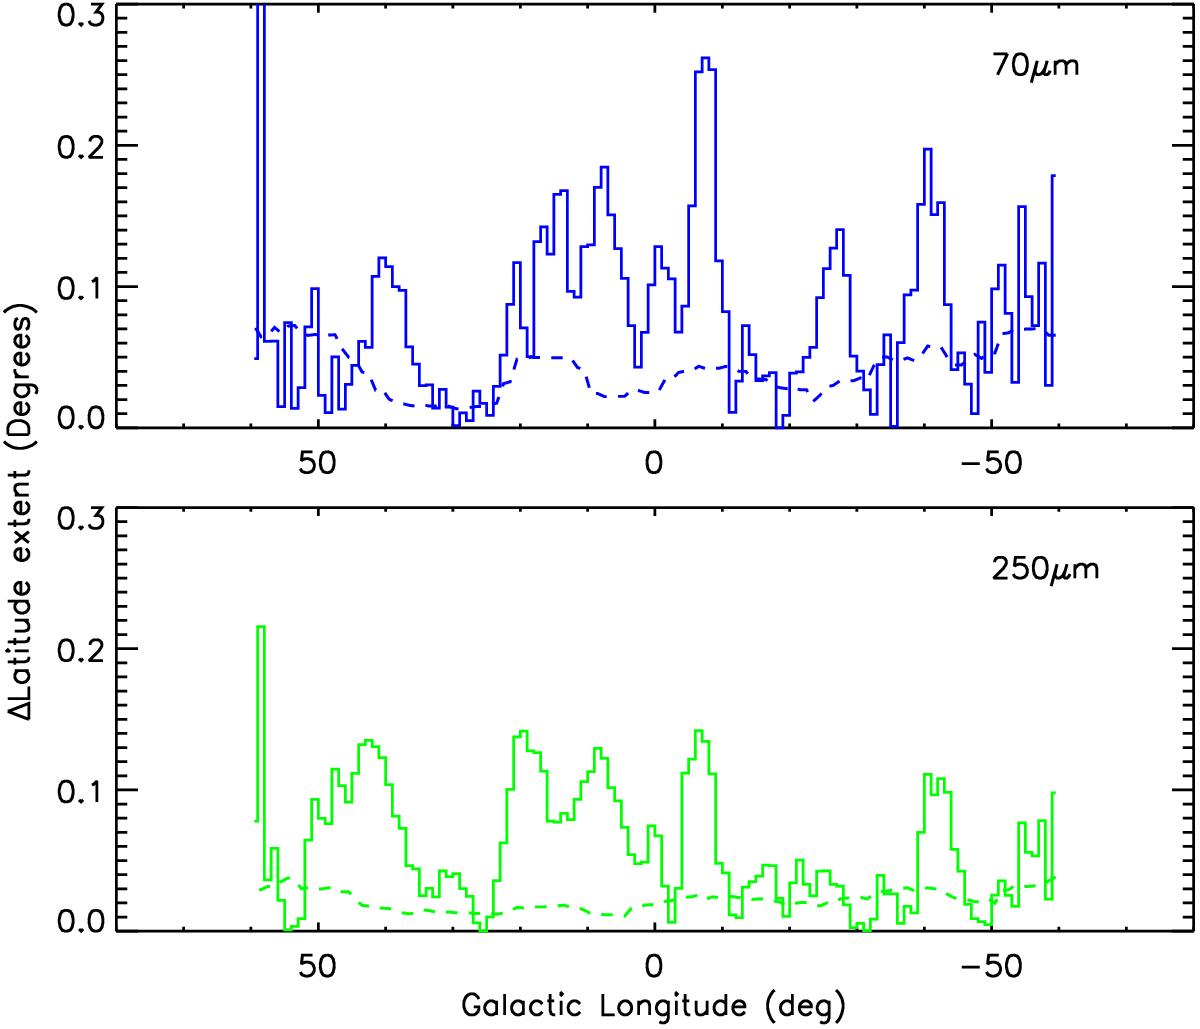
Full-line histograms representing as a function of longitude the absolute value of the smoothed median source latitude (the thick lines of Fig. 4), and the running standard deviation (dashed lines) of the residuals between the median latitude and its smoothed function (i.e., the difference between the thin and thick lines in Fig. 4), computed using a boxcar of 10 deg. The upper panel shows the result for the 70-μm sources in blue, and the lower panel shows the 250-μm sources in green. We only used those Hi-GAL sources with a counterpart in at least 3 adjacent bands.
Current usage metrics show cumulative count of Article Views (full-text article views including HTML views, PDF and ePub downloads, according to the available data) and Abstracts Views on Vision4Press platform.
Data correspond to usage on the plateform after 2015. The current usage metrics is available 48-96 hours after online publication and is updated daily on week days.
Initial download of the metrics may take a while.