Fig. 4
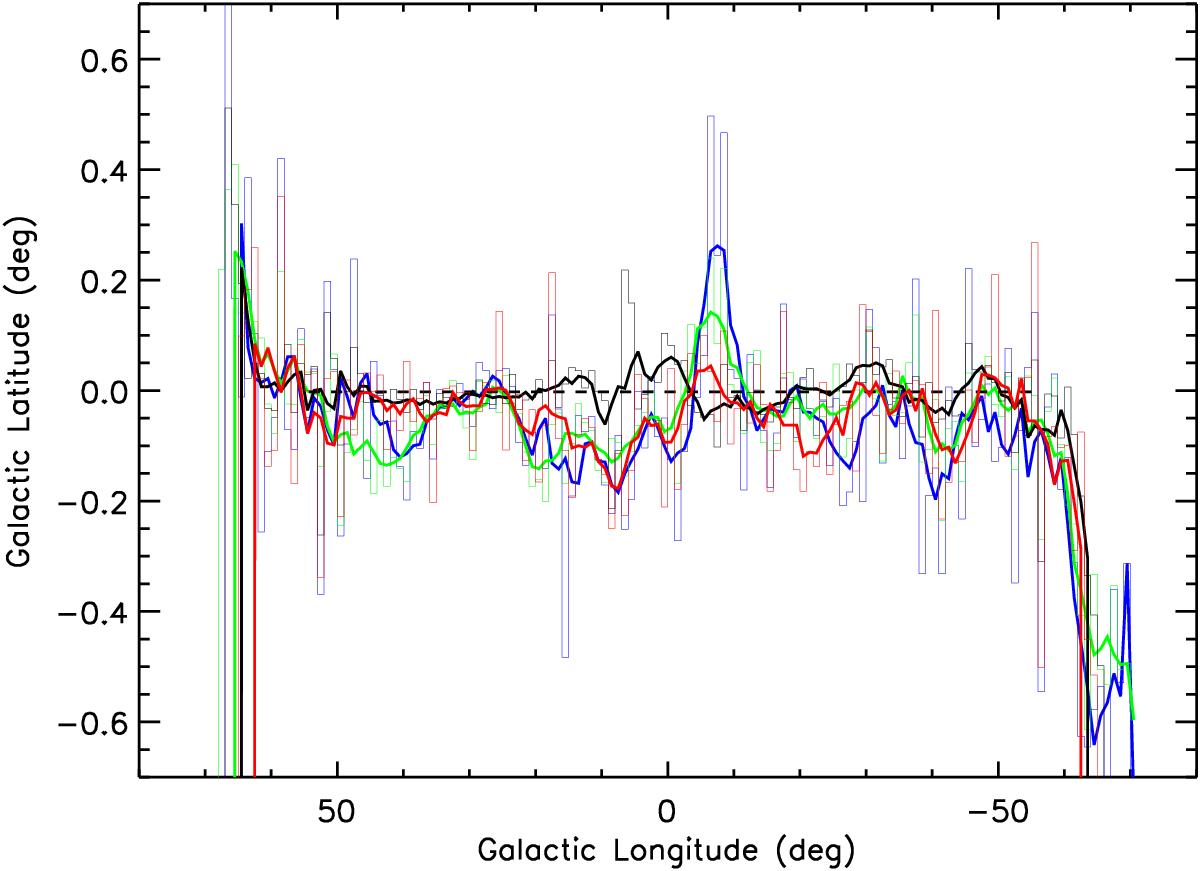
Histograms representing the distribution of the median Galactic latitude of the Hi-GAL sources detected at 70 μm (blue line) and at 250 μm (green line), each with counterparts in at least two adjacent bands. The histograms are computed in 1° longitude bins, together with the analogous distribution of entire sample of MIPSGAL 24-μm sources (black line). The distribution of the subsample of MIPSGAL 24 μm sources selected by Robitaille et al. (2008) using colour criteria targeted towards Young Stellar Objects (YSOs) is shown with the red line. The thick coloured lines show the result of a 5°-wide running boxcar smooth. The horizontal dashed black line reports the median latitude of all MIPSGAL 24-μm sources that essentially coincides with the nominal b = 0° midplane.
Current usage metrics show cumulative count of Article Views (full-text article views including HTML views, PDF and ePub downloads, according to the available data) and Abstracts Views on Vision4Press platform.
Data correspond to usage on the plateform after 2015. The current usage metrics is available 48-96 hours after online publication and is updated daily on week days.
Initial download of the metrics may take a while.