Free Access
Fig. 3
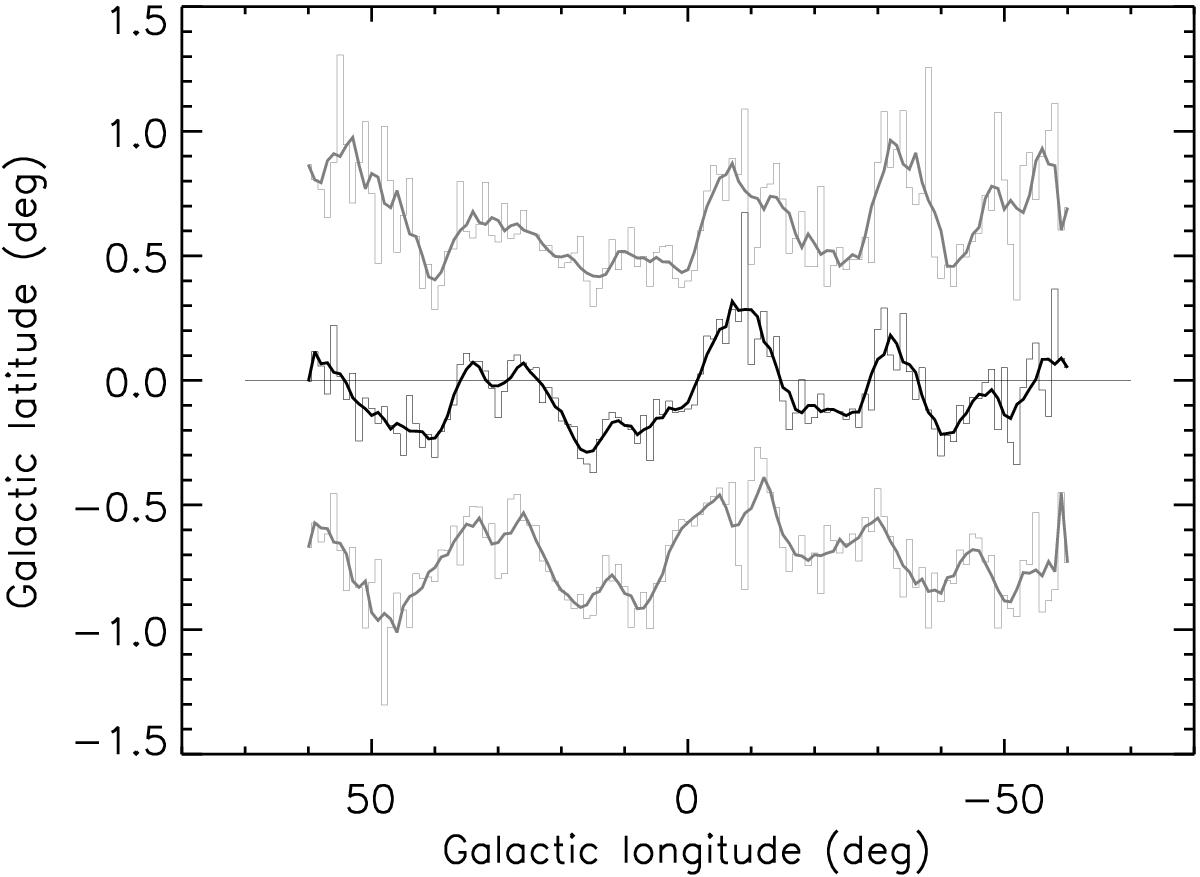
Distribution in Galactic longitude of the latitude values for the centroid (black histogram) and the upper and lower 50%-level values (grey histograms) of the 500-μm emission (see text for a detailed explanation). The thick lines represent the smoothing of the distributions with a 5°-wide running boxcar.
Current usage metrics show cumulative count of Article Views (full-text article views including HTML views, PDF and ePub downloads, according to the available data) and Abstracts Views on Vision4Press platform.
Data correspond to usage on the plateform after 2015. The current usage metrics is available 48-96 hours after online publication and is updated daily on week days.
Initial download of the metrics may take a while.