Fig. 2
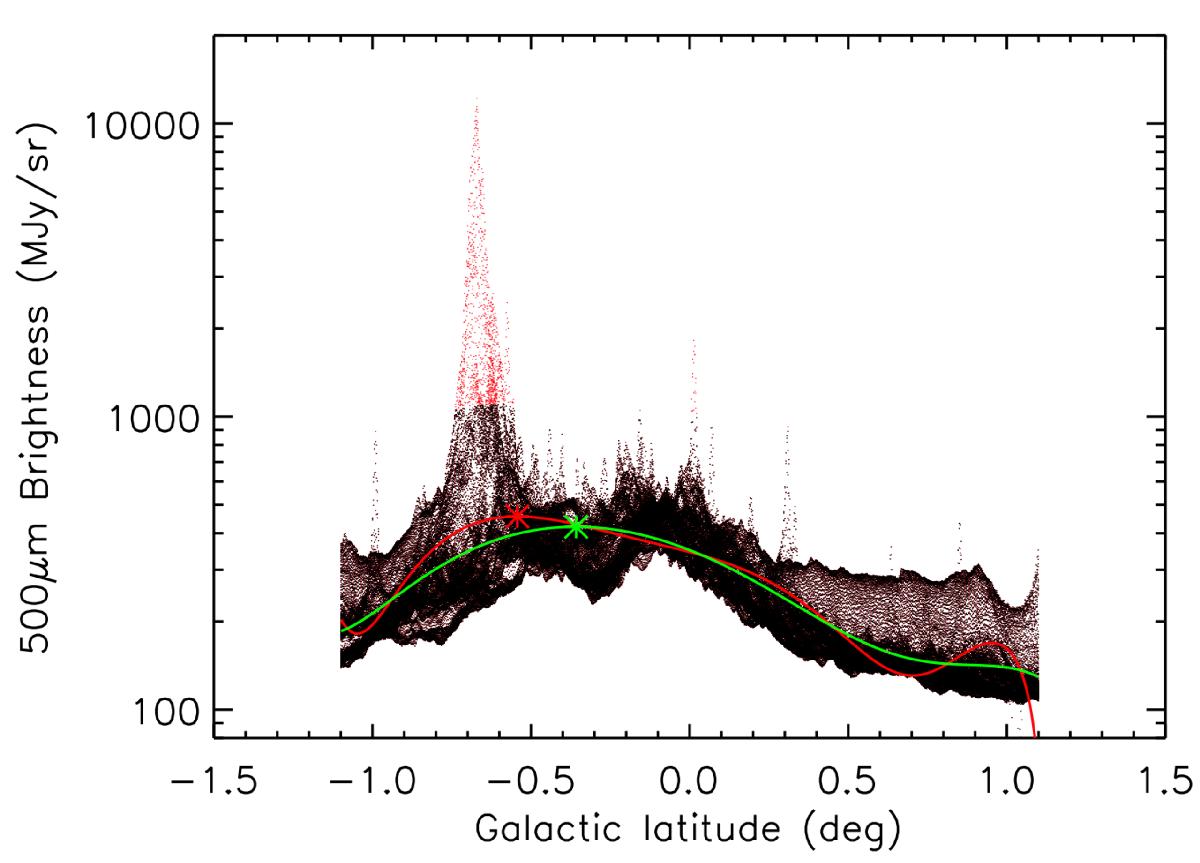
500-μm brightness values (all the points) as a function of Galactic latitude in the longitude interval 14.̊5 ≤ l ≤ 15.̊5 from the map in Fig. 1b. (This longitude range contains M16, which is clearly visible as the large bump at b ~ −0.̊7.) The red thick line is the 7th-order polynomial fit to all points, and the red points are those that are clipped away because they lie above 3 times the rms of the residuals (after subtracting the fit). The green thick line is the 5th-order polynomial fit to all points that survived this clipping (all the black points). The thick crosses indicate the positions of the maxima of each respective fit.
Current usage metrics show cumulative count of Article Views (full-text article views including HTML views, PDF and ePub downloads, according to the available data) and Abstracts Views on Vision4Press platform.
Data correspond to usage on the plateform after 2015. The current usage metrics is available 48-96 hours after online publication and is updated daily on week days.
Initial download of the metrics may take a while.