Fig. 9
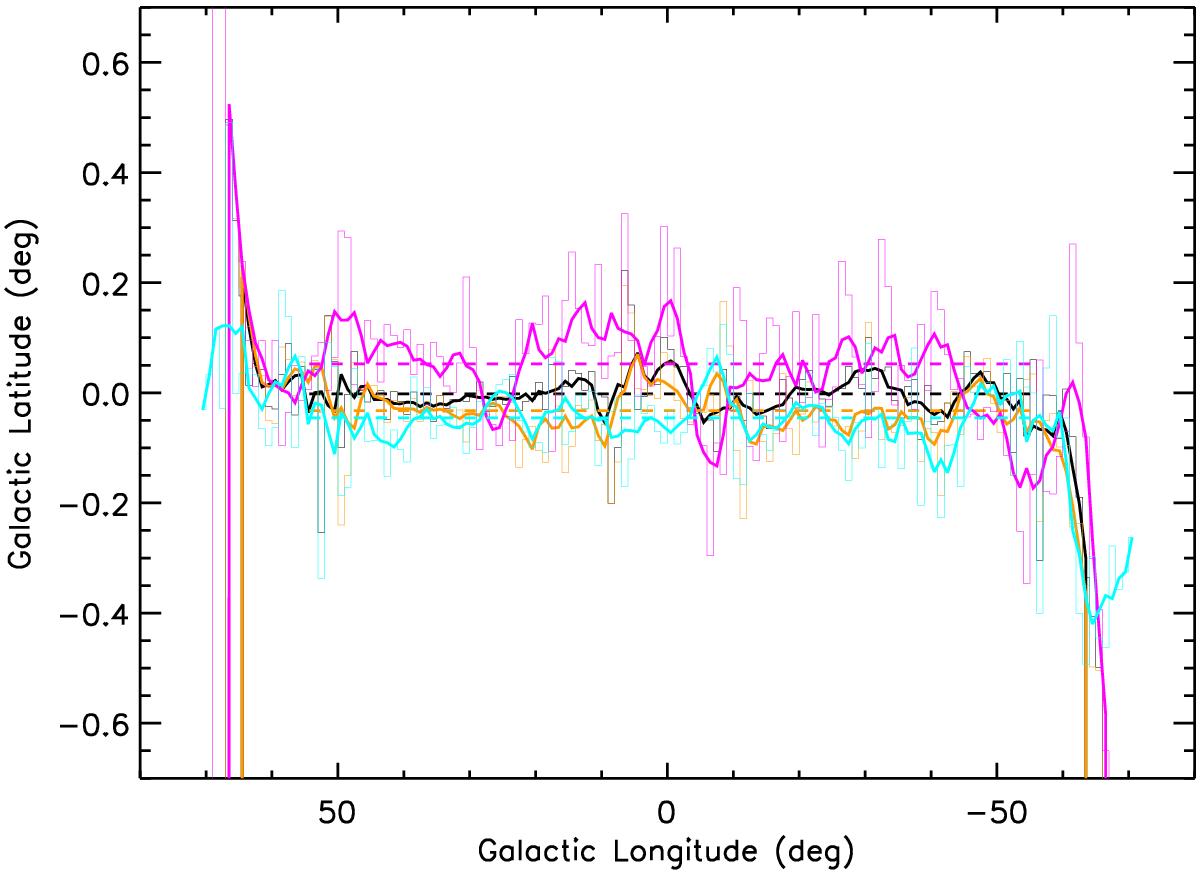
Same as Fig. 4 for the distribution of MIPSGAL 24 μm sources alone. The black line is reported straight from Fig. 4 for comparison. The orange line represents the distribution again from the Shenoy et al. (in prep.) catalogue but for sources with fluxes above 3.5 mJy. The cyan line represents the distribution from the WISE 22 μm source catalogue with flux above 6 mJy. The magenta line instead represents the distribution of the 24 μm sources from the catalogue in Gutermuth & Heyer (2015) that are above the respective 90% completeness limit.
Current usage metrics show cumulative count of Article Views (full-text article views including HTML views, PDF and ePub downloads, according to the available data) and Abstracts Views on Vision4Press platform.
Data correspond to usage on the plateform after 2015. The current usage metrics is available 48-96 hours after online publication and is updated daily on week days.
Initial download of the metrics may take a while.