Fig. 8
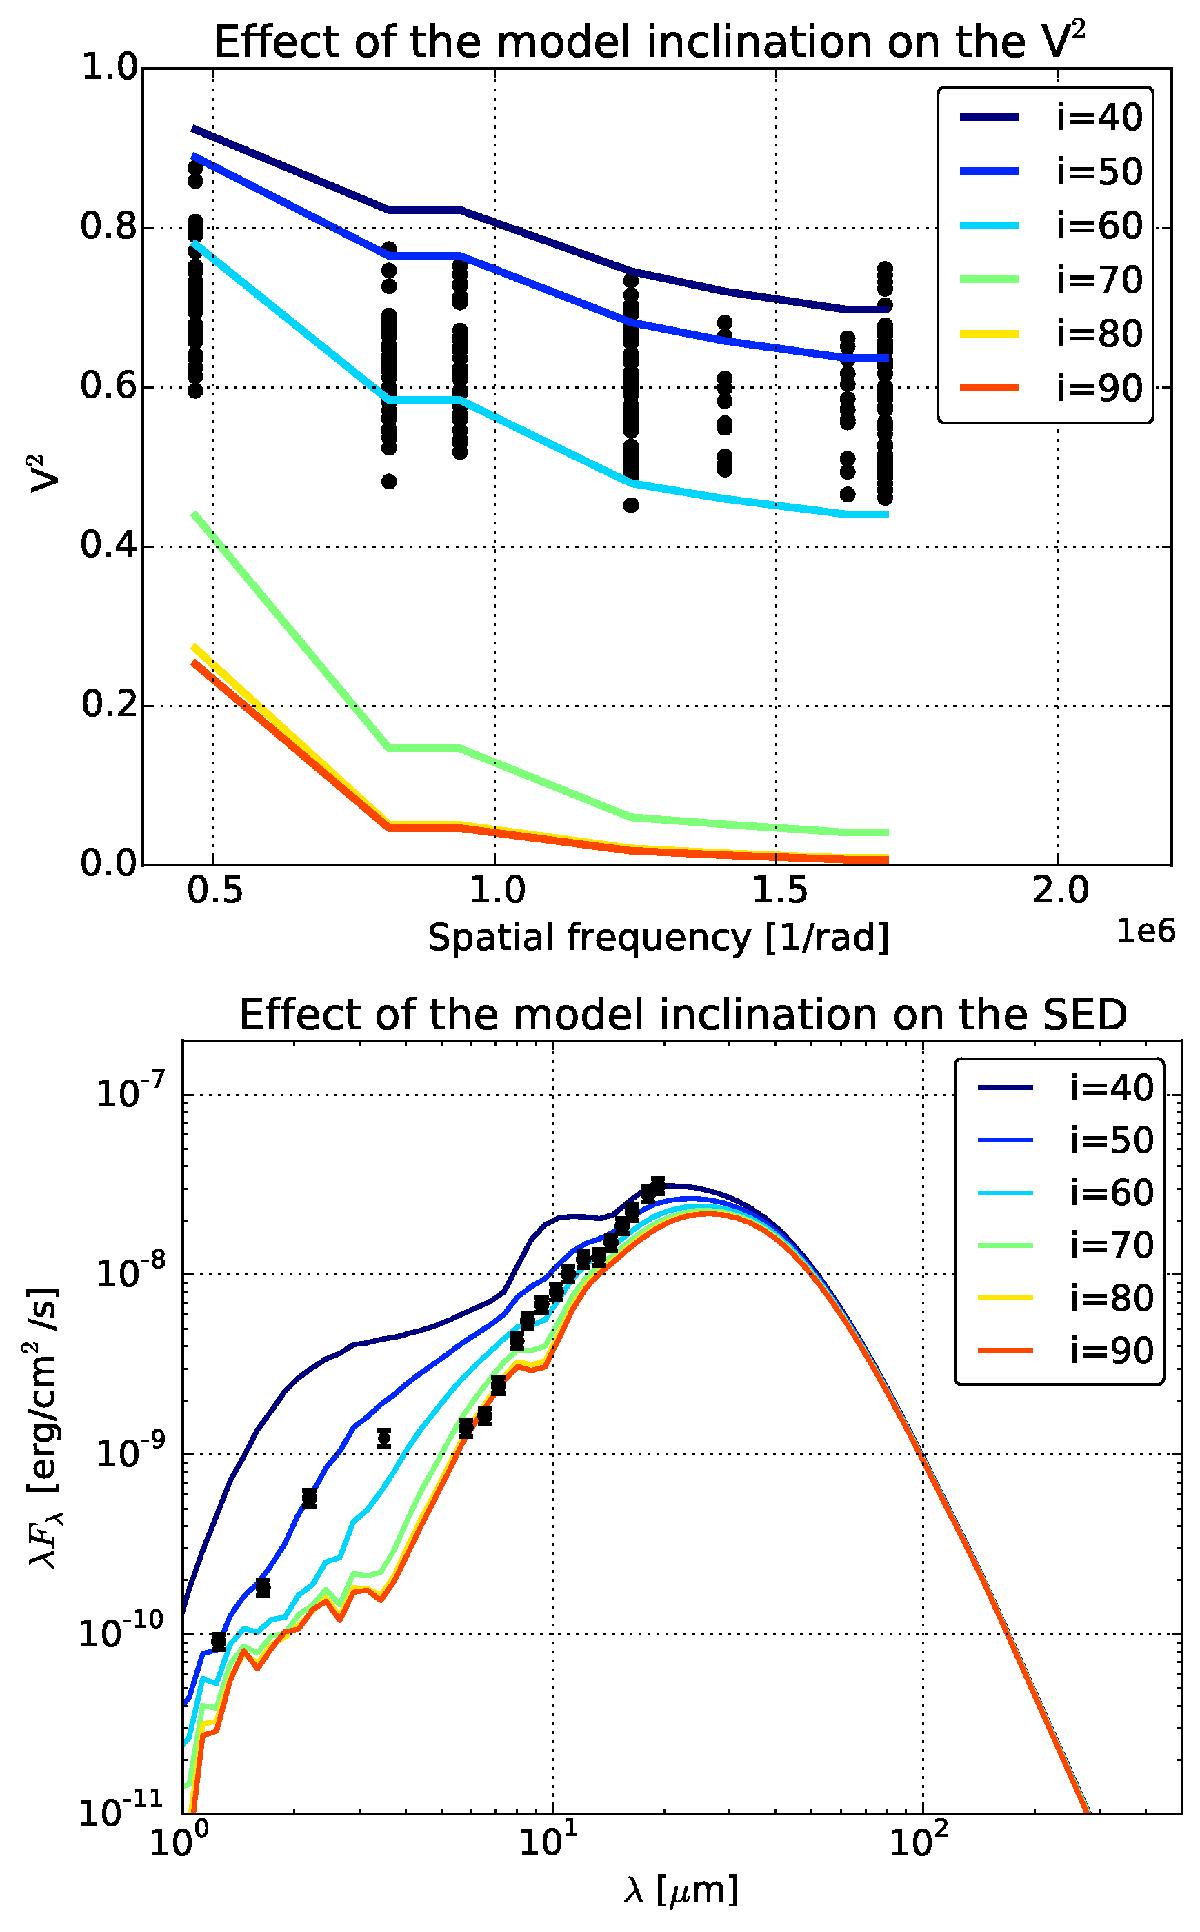
Effect of changing in the inclination angle, i, of the model on the simulated V2 and SED. On the upper panel, the effect of modifying i on the NACO/SAM L′-filter is observed. On the lower panel, the effect of changing i over the SED is displayed. The different colors correspond to different values of i, while the black dots represent the data in both panels. In this example, the rest of the model parameters remained fixed to the values of the best-fit model presented in this work
Current usage metrics show cumulative count of Article Views (full-text article views including HTML views, PDF and ePub downloads, according to the available data) and Abstracts Views on Vision4Press platform.
Data correspond to usage on the plateform after 2015. The current usage metrics is available 48-96 hours after online publication and is updated daily on week days.
Initial download of the metrics may take a while.