Free Access
Fig. 6
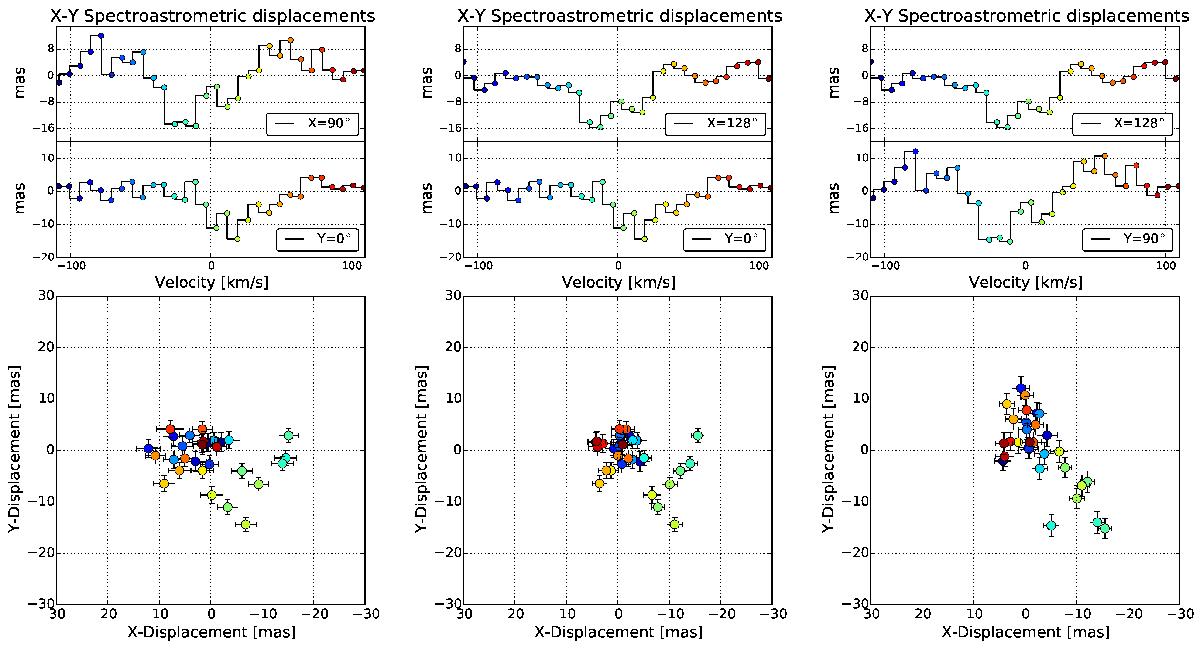
2D plots of the Brγ SA signals. Each panel in the columns represents the flux centroid displacements at two given position angles, as indicated at the top SA signals. Each spectral bin is represented by different colors, the uncertainties in the flux centroid displacements are also plotted.
This figure is made of several images, please see below:
Current usage metrics show cumulative count of Article Views (full-text article views including HTML views, PDF and ePub downloads, according to the available data) and Abstracts Views on Vision4Press platform.
Data correspond to usage on the plateform after 2015. The current usage metrics is available 48-96 hours after online publication and is updated daily on week days.
Initial download of the metrics may take a while.