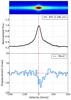
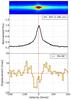
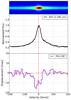
Fig. 5
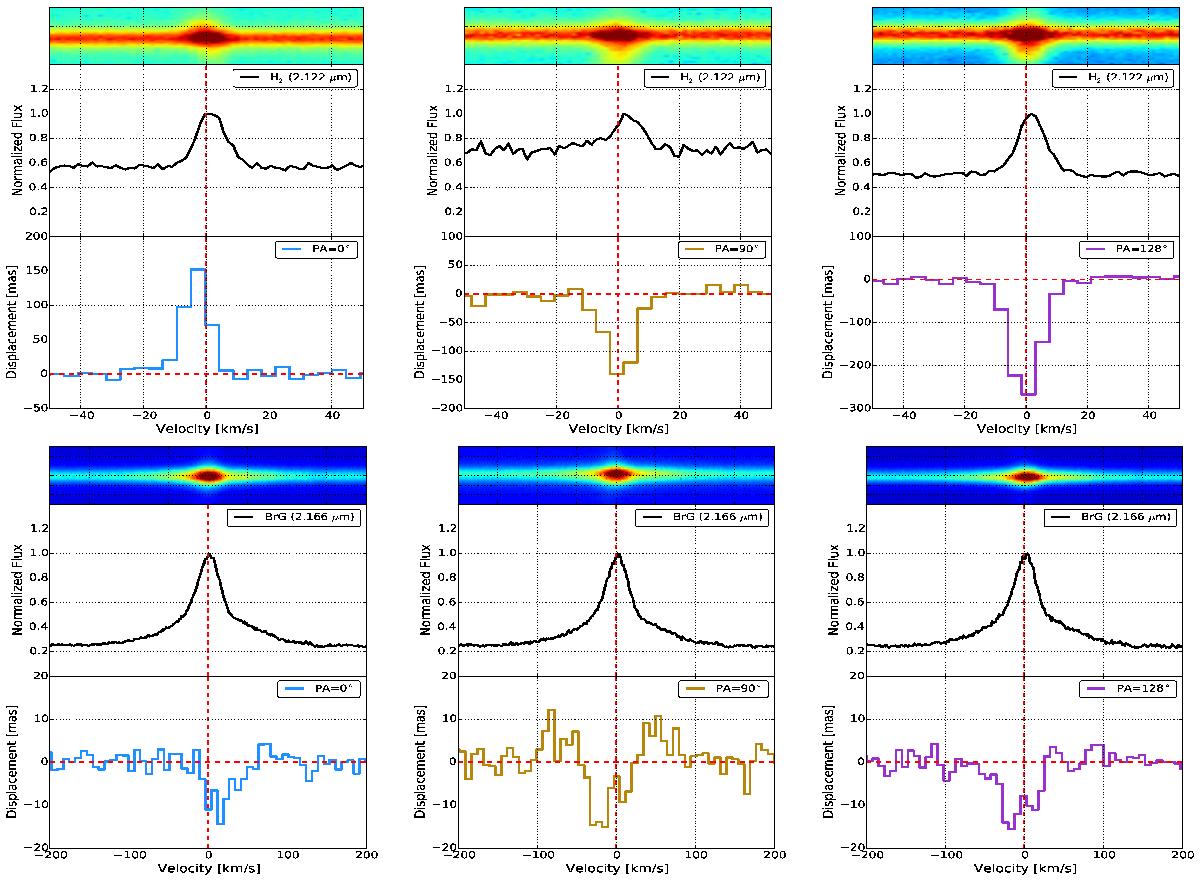
Spectroastrometric signals of the H2 and Brγ lines of IRS 9A. The H2 emission line appears to originate from the large-scale structure of IRS 9A while the Brγ line is formed at the core of IRS 9A. The spectroastrometric signal of the line displayed is weighted with wf. The mean ratio Fλ(continuum)/Fλ(line) is of ~0.9 and ~0.5 for the H2 and the Brγ line, respectively. The 2D spectral lines are also displayed in colors.
Current usage metrics show cumulative count of Article Views (full-text article views including HTML views, PDF and ePub downloads, according to the available data) and Abstracts Views on Vision4Press platform.
Data correspond to usage on the plateform after 2015. The current usage metrics is available 48-96 hours after online publication and is updated daily on week days.
Initial download of the metrics may take a while.