Free Access
Fig. 4
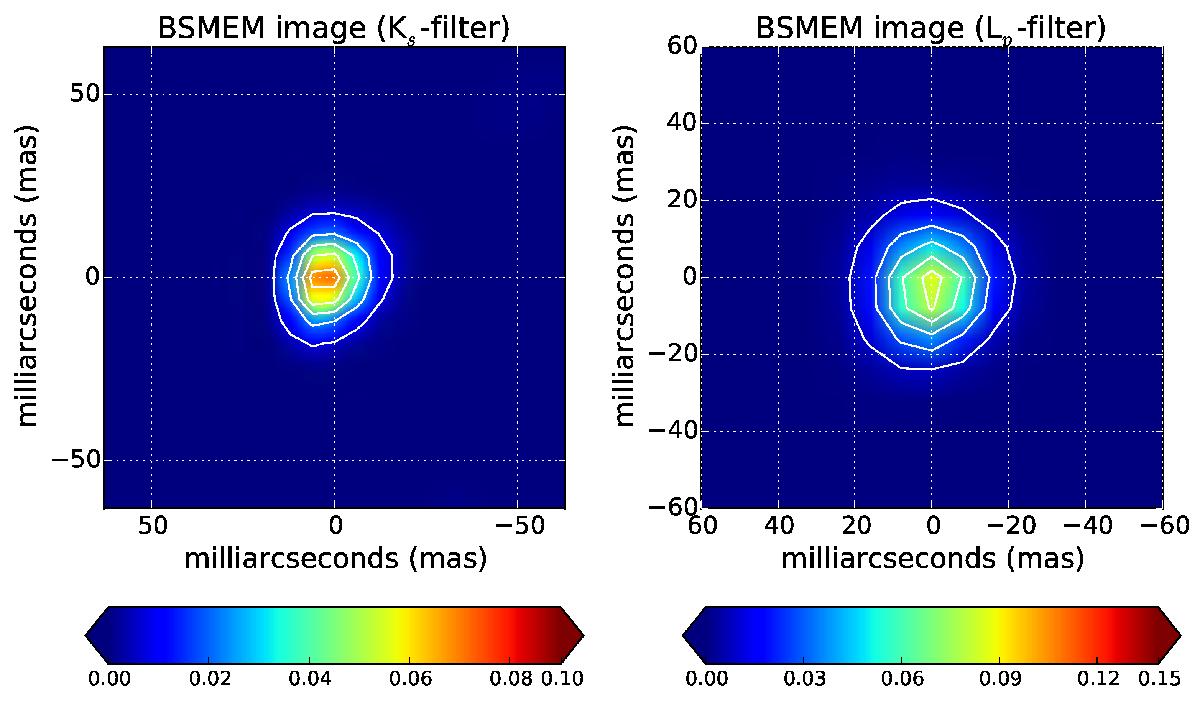
Reconstructed images of IRS 9A from the NACO/SAM data using BSMEM. The left panel shows the image for Ks and the right panel the image for L′. The total flux of the images is normalized to unity. Each panel has overplotted black contours that correspond to 10, 30, 50, 70, 90% of the peak flux.
Current usage metrics show cumulative count of Article Views (full-text article views including HTML views, PDF and ePub downloads, according to the available data) and Abstracts Views on Vision4Press platform.
Data correspond to usage on the plateform after 2015. The current usage metrics is available 48-96 hours after online publication and is updated daily on week days.
Initial download of the metrics may take a while.