Fig. 13
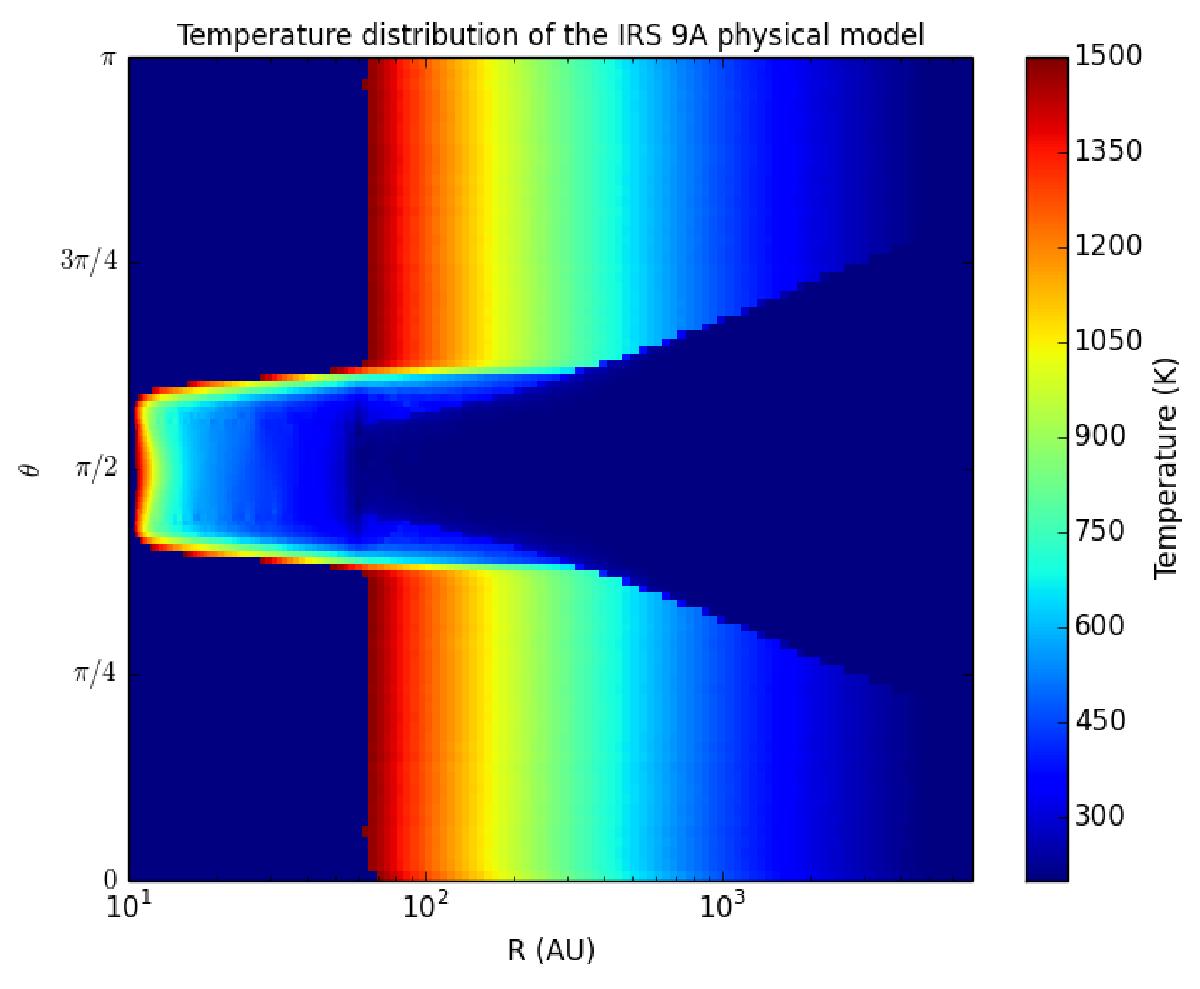
Radial cut of the temperature distribution of the dust around IRS 9A. The picture displays the temperature profile of the disk and the envelope obtained with our best radiative transfer model. The axis is given in spherical coordinates (R, θ) and the colors represent different temperature values of the dust. Also, confusion with other (extended or stellar) sources in the crowded IRS 9 region may be an important source of bias in the SED at certain wavelengths.
Current usage metrics show cumulative count of Article Views (full-text article views including HTML views, PDF and ePub downloads, according to the available data) and Abstracts Views on Vision4Press platform.
Data correspond to usage on the plateform after 2015. The current usage metrics is available 48-96 hours after online publication and is updated daily on week days.
Initial download of the metrics may take a while.