Free Access
Fig. 10
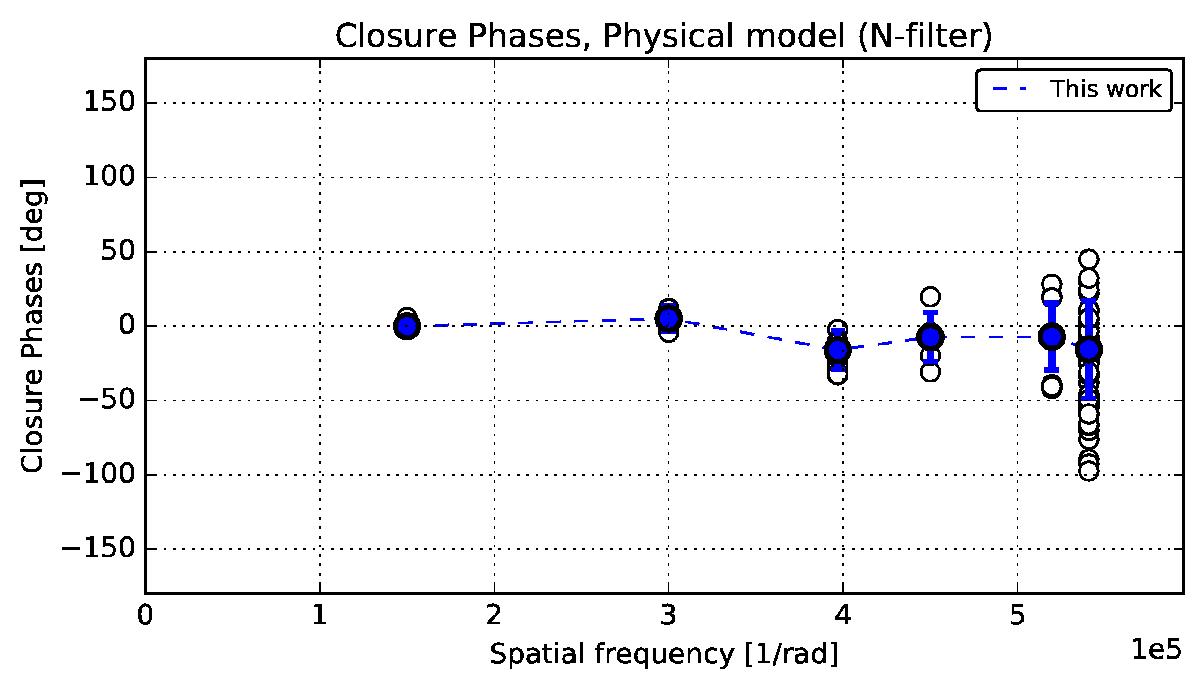
Best-fit of our radiative transfer model to the T-ReCS closure phases. The data are displayed with open black circles and the mean value of the model closure phase is shown with a filled blue circle and with a vertical bar that indicates the variation as a function of azimuth angle.
Current usage metrics show cumulative count of Article Views (full-text article views including HTML views, PDF and ePub downloads, according to the available data) and Abstracts Views on Vision4Press platform.
Data correspond to usage on the plateform after 2015. The current usage metrics is available 48-96 hours after online publication and is updated daily on week days.
Initial download of the metrics may take a while.