Fig. 1
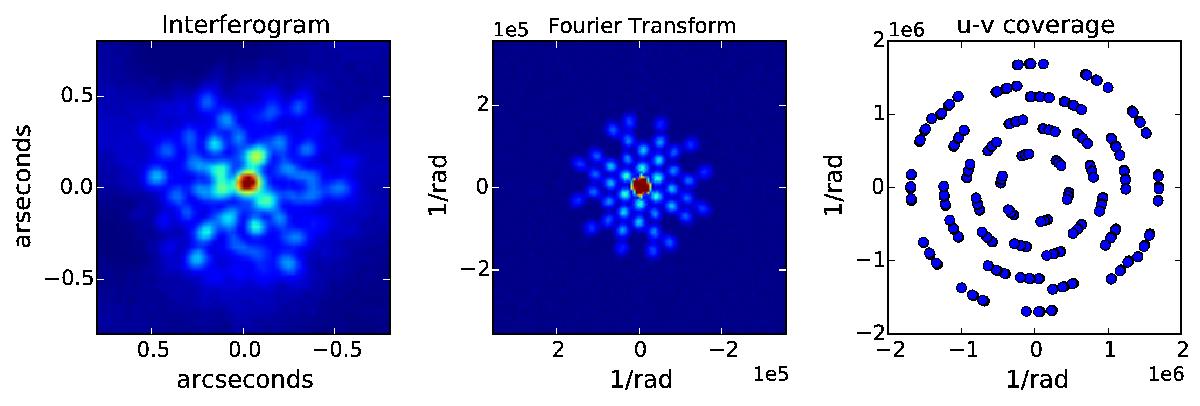
Left: IRS 9A: average interferogram in the image plane observed in a sparse aperture masking (SAM) data cube. Center: Fourier transform of an average interferogram. The 42 blue spots correspond to the sampled visibilities and their complex conjugates, while the central red spot is the DC component of the Fourier transform and it is proportional to the squared of the total flux in the interferogram. Right: UV coverage of our SAM observations.
Current usage metrics show cumulative count of Article Views (full-text article views including HTML views, PDF and ePub downloads, according to the available data) and Abstracts Views on Vision4Press platform.
Data correspond to usage on the plateform after 2015. The current usage metrics is available 48-96 hours after online publication and is updated daily on week days.
Initial download of the metrics may take a while.