Free Access
Fig. 2
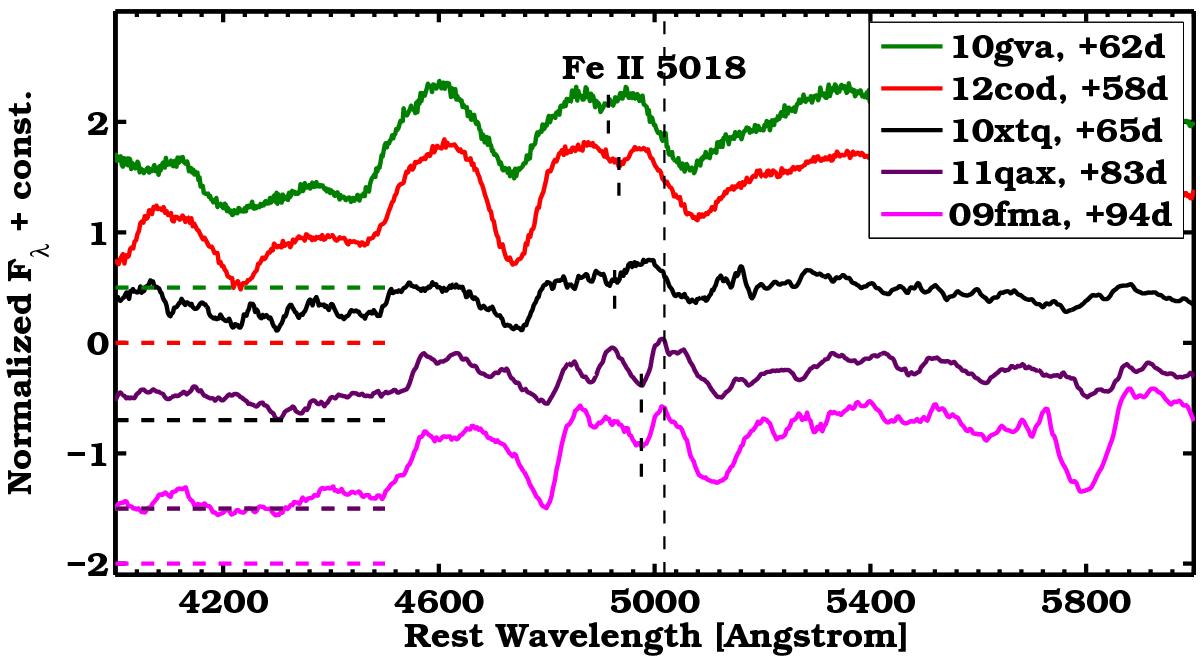
Examples of SN II spectra with small pEW5018. The Fe iiλ5018 rest wavelength is marked by a vertical dashed line, the absorption minima by vertical dashed segments. The spectra are normalized by their median, offset by a constant (dashed horizontal lines), and shown in the rest frame.
Current usage metrics show cumulative count of Article Views (full-text article views including HTML views, PDF and ePub downloads, according to the available data) and Abstracts Views on Vision4Press platform.
Data correspond to usage on the plateform after 2015. The current usage metrics is available 48-96 hours after online publication and is updated daily on week days.
Initial download of the metrics may take a while.