Fig. 2
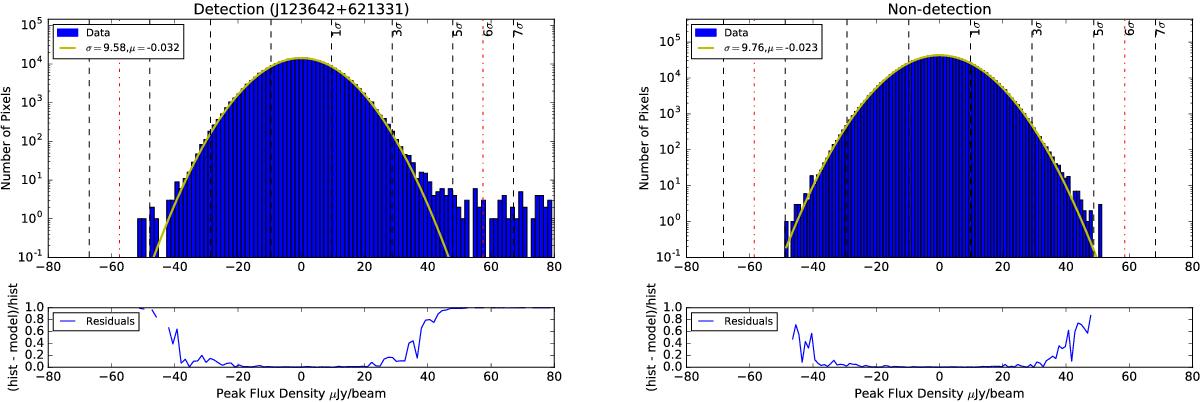
Upper panels: histograms of the peak brightness distributions for fields with detected sources and no detected sources. Each histogram is derived from 1024 × 1024 pixel, uniformly weighted image and has a Gaussian distribution fitted to the noise profile. The vertical dashed lines indicate the values of ±1σ, ±3σ, ±5σ and ±7σ and the red dot-dashed line represents the 6σ detection threshold. Bottom panels: residuals which are normalised to the histogram. Left panel: histogram of the field including the source J123642 + 621331. The fitted Gaussian approximates an rms noise level of 9.58 μJy/beam. There are large deviations from the Gaussian model at the negative extrema of the flux distribution, which suggests that gain and phase errors are the cause. The deviations at the positive extrema is due to source structure. Right panel: histogram of a blank field with phase centre coordinates RA 12:36:05.0 and Dec. +62:12:30.0. A Gaussian with a 1σ rms noise level of 9.76 μJy/beam is fitted. The residuals show smaller deviations from a Gaussian at the extrema of the flux distribution. This may be due to some residual radio frequency interference.
Current usage metrics show cumulative count of Article Views (full-text article views including HTML views, PDF and ePub downloads, according to the available data) and Abstracts Views on Vision4Press platform.
Data correspond to usage on the plateform after 2015. The current usage metrics is available 48-96 hours after online publication and is updated daily on week days.
Initial download of the metrics may take a while.