Fig. 5
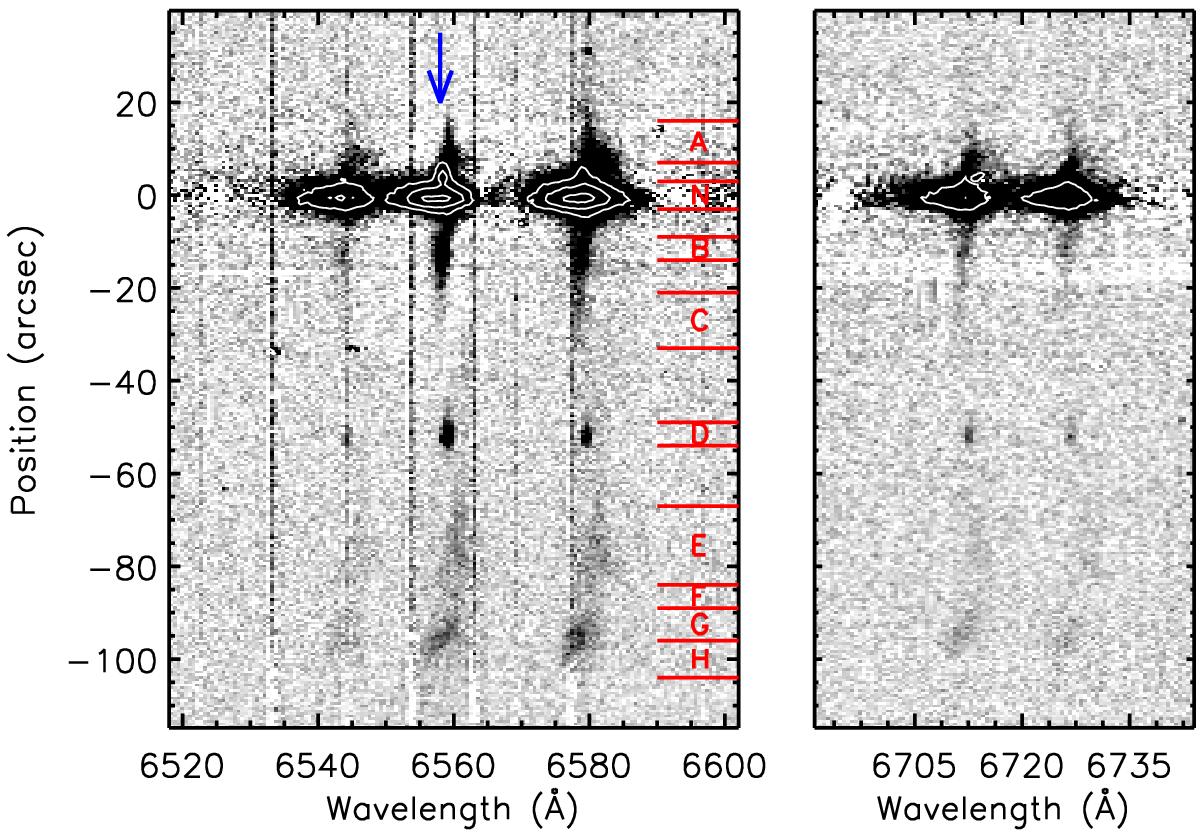
2D continuum subtracted spectrum of NGC 4569 zoomed on the Hα and [NII] lines (left) and on the [SII] doublet (right), as obtained at Calar Alto with a slit of width 1.2 arcsec positioned along the minor axis on the spur of ionized gas as indicated in Fig. 6. The red labels shown in the left panel correspond to those shown in Fig. 6 and indicate the range of pixels used to extract 1D spectra to derive the physical parameters given in Table 2. The blue vertical arrow shows the mean recessional velocity of the galaxy (−221 km s-1) derived from HI data.
Current usage metrics show cumulative count of Article Views (full-text article views including HTML views, PDF and ePub downloads, according to the available data) and Abstracts Views on Vision4Press platform.
Data correspond to usage on the plateform after 2015. The current usage metrics is available 48-96 hours after online publication and is updated daily on week days.
Initial download of the metrics may take a while.