Fig. 4
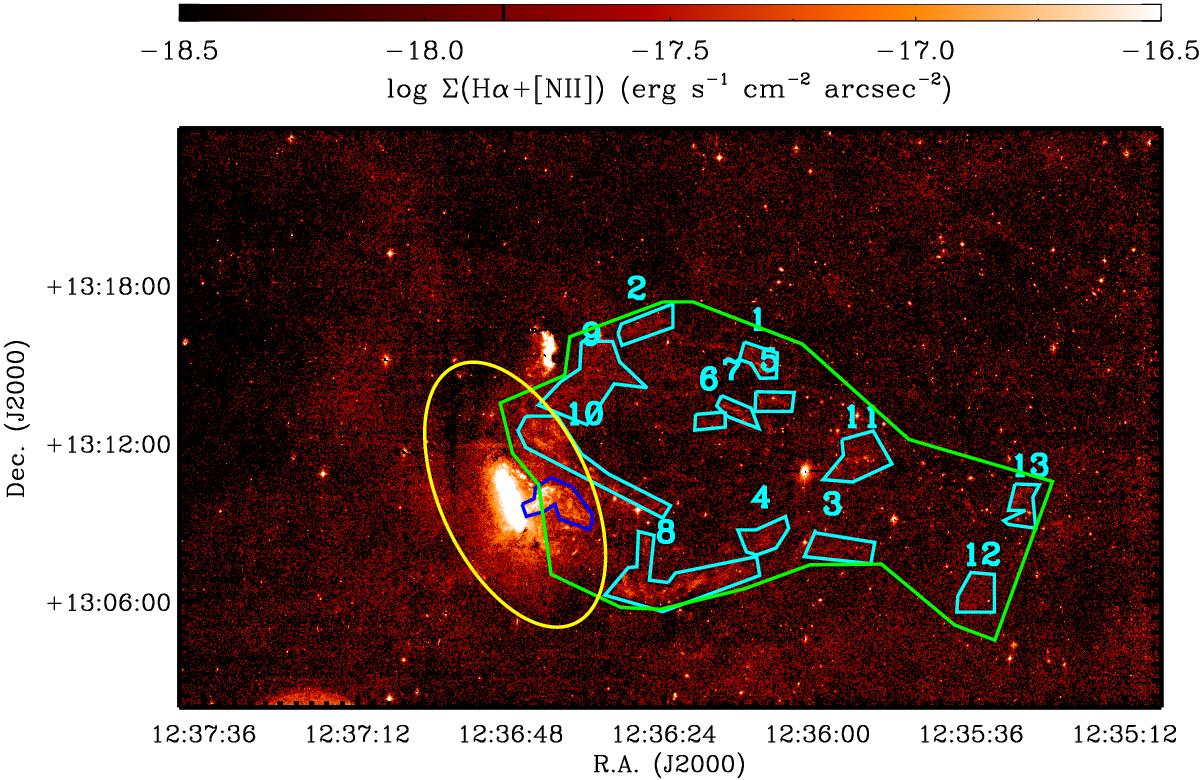
CFHT MegaCam Hα+[NII] image of NGC 4569 and IC 3583 smoothed as in Fig. 1. The different low surface-brightness regions with Hα+[NII] emission are indicated with cyan polygons, and their surface brightness is listed in Table 3. The yellow elliptical aperture indicates the adopted extension of the galaxy within which its total Hα+[NII] flux has been measured (Table 1). The total emission within the tail has been measured within the large green polygon, while that of the nuclear outflow, within the blue polygon.
Current usage metrics show cumulative count of Article Views (full-text article views including HTML views, PDF and ePub downloads, according to the available data) and Abstracts Views on Vision4Press platform.
Data correspond to usage on the plateform after 2015. The current usage metrics is available 48-96 hours after online publication and is updated daily on week days.
Initial download of the metrics may take a while.