Fig. 19
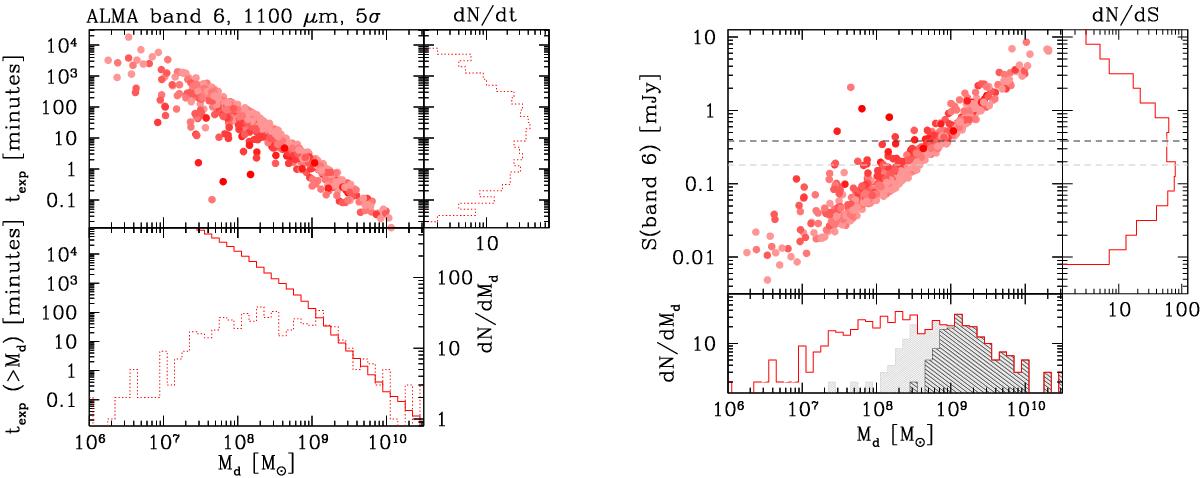
Further results of DL07 SED fitting including artificial ALMA band 6 photometry. Color coding is based on the number of available photometric bands (see Fig. 17). Left: exposure time estimate (without overheads) for ALMA band 6 observations of Herschel-detected galaxies. The texp estimate for individual sources (upper bigger panel, dots) are shown and summed up to compute the cumulative texp needed to observe all sources above a given value of Mdust (solid histograms). Dotted histograms represent the number distribution of sources. Right: distribution of ALMA band 6 expected fluxes, as a function of dust mass, for galaxies detected by Herschel in the GOODS-S field. The horizontal dashed lines correspond to 0.38 and 0.18 [mJy] flux limits (dark and light gray, respectively). The right side and bottom panel show the projected 1D distributions. The hatched dark and light gray histograms only include sources above the flux limits indicated.
Current usage metrics show cumulative count of Article Views (full-text article views including HTML views, PDF and ePub downloads, according to the available data) and Abstracts Views on Vision4Press platform.
Data correspond to usage on the plateform after 2015. The current usage metrics is available 48-96 hours after online publication and is updated daily on week days.
Initial download of the metrics may take a while.