Fig. 16
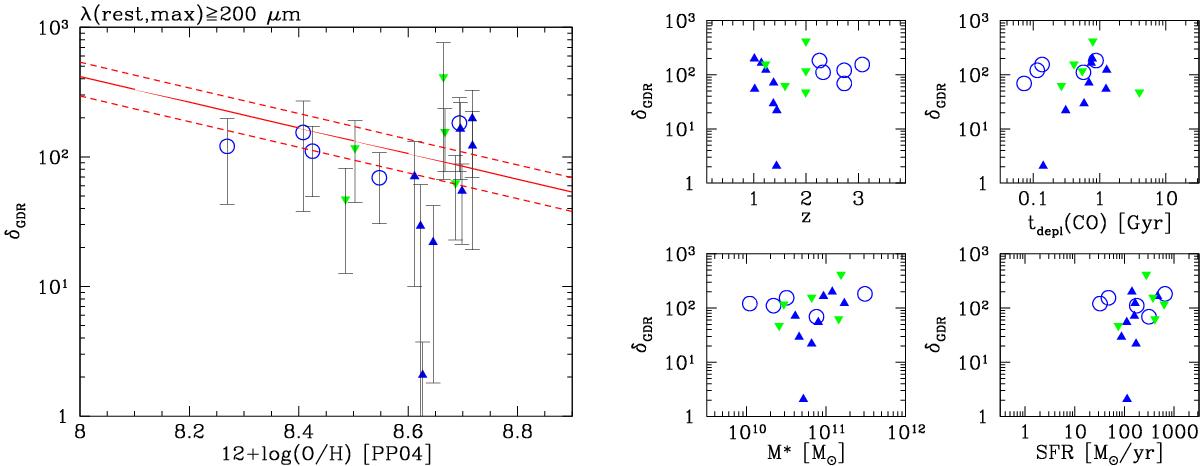
Gas-to-dust mass ratio, δGDR, of CO-detected galaxies with rest-frame λmax ≥ 200μm, computed by combining CO-based gas masses and DL07-based dust masses. Symbols are as in Fig. 13. Left: δGDR as a function of metallicity. The red lines represent the local relation by Magdis et al. (2012) and its 0.15 dex scatter. Right: δGDR as a function of other relevant parameters: redshift z; depletion times based on CO; M∗ (Wuyts et al. 2011a); and ![]() .
.
Current usage metrics show cumulative count of Article Views (full-text article views including HTML views, PDF and ePub downloads, according to the available data) and Abstracts Views on Vision4Press platform.
Data correspond to usage on the plateform after 2015. The current usage metrics is available 48-96 hours after online publication and is updated daily on week days.
Initial download of the metrics may take a while.