Fig. 13
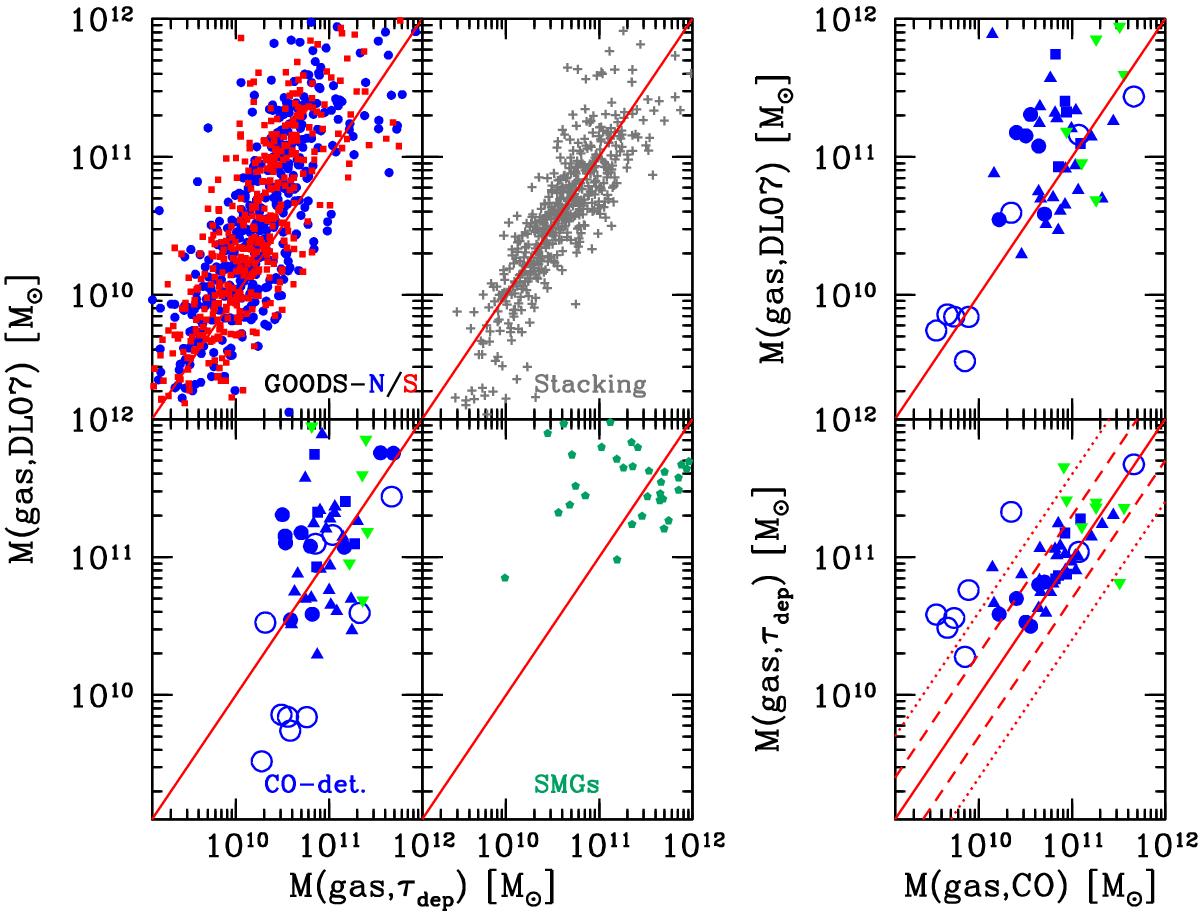
Comparison of three different Mgas estimates: the first is based on CO (rescaled to a common αCO,MW = 4.36, including a metallicity correction; Genzel et al. 2012, 2013, 2015); the second based on the scaling of depletion times, τdep; and the third derived from Mdust, using the δGDR-Z and M∗-Z relations in the PP04 metallicity scale. Left: datasets include GOODS-N (blue filled circles) and GOODS-S (red filled squares) 160 μm-detected sources; Herschel-detected SMGs (green filled pentagons; Magnelli et al. 2012a); CO-detected galaxies (different blue symbols, see below); and the Magnelli et al. (2014) stacked points (gray crosses). The right-hand panels only include CO-detected sources, namely: PHIBSS galaxies (blue triangles, Tacconi et al. 2013); BzK galaxies (blue squares, Daddi et al. 2010); other star-forming galaxies (blue filled circles, Magnelli et al. 2012b); lensed galaxies (empty blue circles, Saintonge et al. 2013); and SMGs (green upside down triangles, Bothwell et al. 2013). The dashed and dotted lines in the lower-right panel mark the ± 0.3 and ± 0.6 dex deviations from the 1:1 locus (solid line).
Current usage metrics show cumulative count of Article Views (full-text article views including HTML views, PDF and ePub downloads, according to the available data) and Abstracts Views on Vision4Press platform.
Data correspond to usage on the plateform after 2015. The current usage metrics is available 48-96 hours after online publication and is updated daily on week days.
Initial download of the metrics may take a while.