Fig. 10
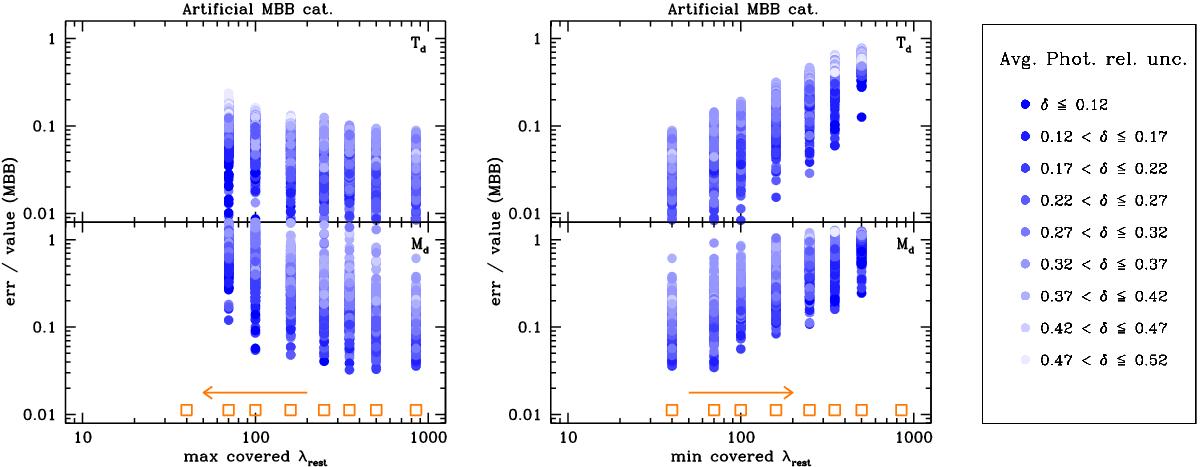
Relative error on dust temperature (top) and dust mass (bottom) obtained with MBB simulations, when erasing long-wavelength bands (left) and short-wavelength bands (right). Color coding is based on the average relative photometric uncertainty computed on the available bands, and is explained in the legend. See text for more details on how to read these diagrams.
Current usage metrics show cumulative count of Article Views (full-text article views including HTML views, PDF and ePub downloads, according to the available data) and Abstracts Views on Vision4Press platform.
Data correspond to usage on the plateform after 2015. The current usage metrics is available 48-96 hours after online publication and is updated daily on week days.
Initial download of the metrics may take a while.