Free Access
Fig. 8
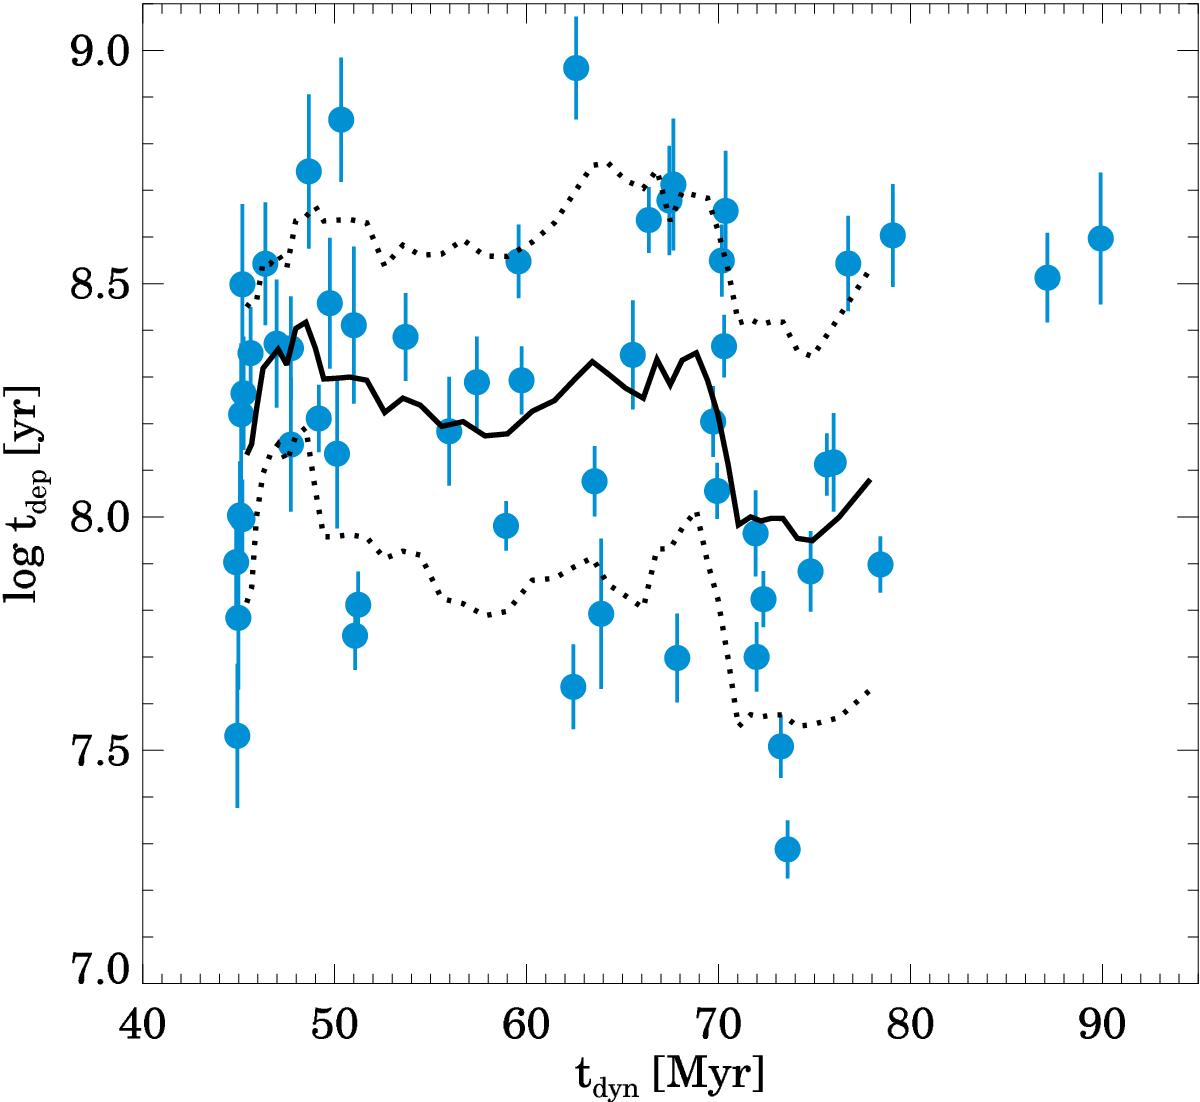
Depletion time (tdep) as a function of the local dynamical time (tdyn). The solid black line indicates the running average tdep value over ten regions. The dotted lines represent the 1σ dispersion of this average.
Current usage metrics show cumulative count of Article Views (full-text article views including HTML views, PDF and ePub downloads, according to the available data) and Abstracts Views on Vision4Press platform.
Data correspond to usage on the plateform after 2015. The current usage metrics is available 48-96 hours after online publication and is updated daily on week days.
Initial download of the metrics may take a while.