Fig. 7
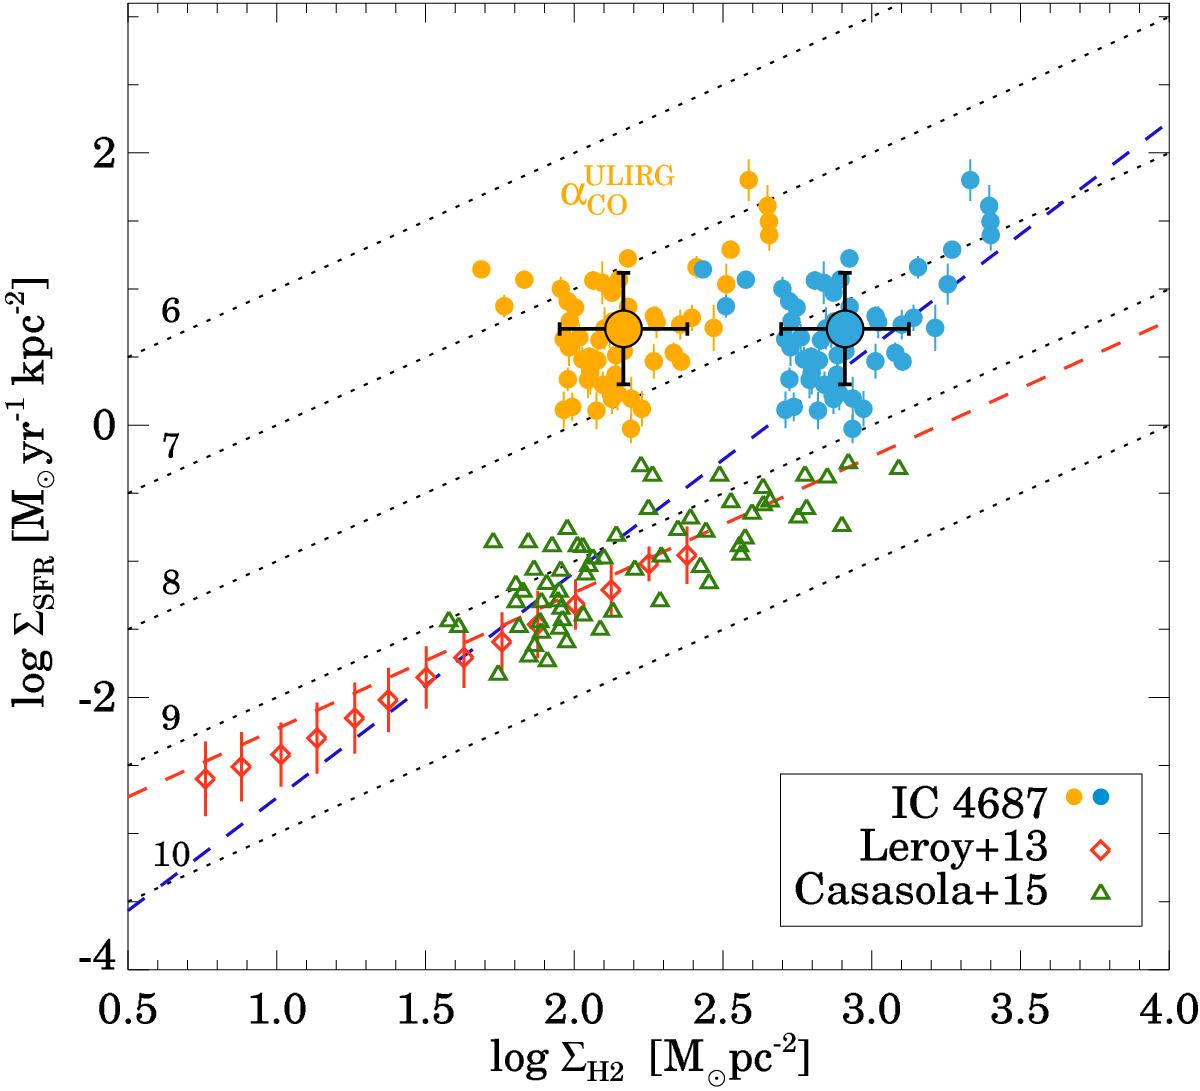
SFR surface density as function of the molecular gas surface density. The circles correspond to the 250 pc regions defined for IC 4687 (Sect. 3.2). For the orange circles we applied the CO-to-H2 conversion factor of local ULIRGs, while for the blue circles we applied the Milky Way conversion factor. The large circles indicate the average values for the IC 4687 regions. The green triangles and red diamonds indicate spatially resolved measurements in nearby galaxies by Casasola et al. (2015) and Leroy et al. (2013), respectively. The molecular gas tracer for all of them is the CO(2–1) transition. The dotted lines mark constant log tdep times. The dashed blue line is the best fit to all the data (N = 1.6), and the dashed red line represents the best fit excluding the IC 4687 data (N = 1.0).
Current usage metrics show cumulative count of Article Views (full-text article views including HTML views, PDF and ePub downloads, according to the available data) and Abstracts Views on Vision4Press platform.
Data correspond to usage on the plateform after 2015. The current usage metrics is available 48-96 hours after online publication and is updated daily on week days.
Initial download of the metrics may take a while.