Fig. 4
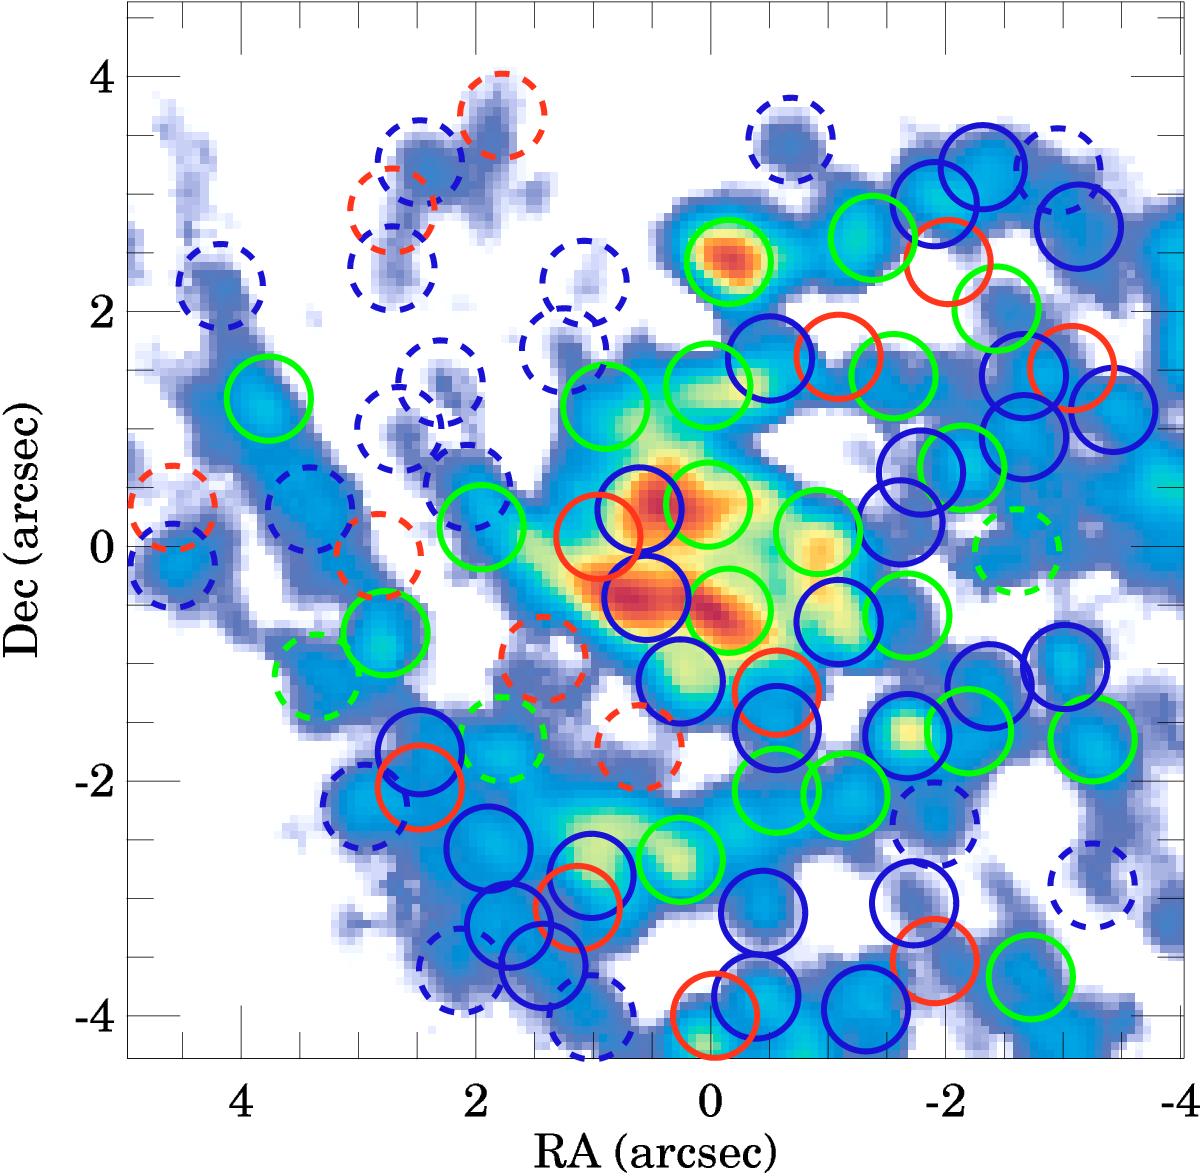
Location of the apertures defined for IC 4687 overlaid on the CO(2–1) map. Blue and red circles indicate apertures only detected at >10σ in the CO(2–1) or the Paα maps, respectively. Green circles indicate regions with both CO(2–1) and Paα emission peaks detected at >10σ level. Dashed circles indicate regions whose Brγ or Brδ emissions are detected below a 6σ level.
Current usage metrics show cumulative count of Article Views (full-text article views including HTML views, PDF and ePub downloads, according to the available data) and Abstracts Views on Vision4Press platform.
Data correspond to usage on the plateform after 2015. The current usage metrics is available 48-96 hours after online publication and is updated daily on week days.
Initial download of the metrics may take a while.