Fig. 1
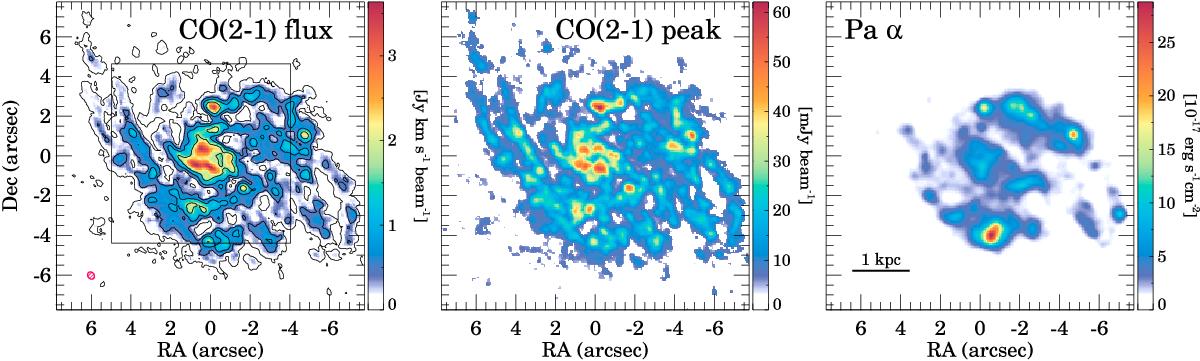
ALMA 12CO(2–1) integrated flux and peak intensity for ~5 km s-1 channels (left and middle panels) and HST/NICMOS Paα map smoothed to the ALMA resolution (right panel) of IC 4687. The contour levels of the left panel indicate the 10, 100, 200, and 400σ levels. The 1σ sensitivity of the data is 1 mJy beam-1 for ~5 km s-1 channels. The red hatched ellipse in the left panel indicates the ALMA beam size (0.̋31×0.̋39, PA 35°). The black square indicates the field of view covered by the VLT/SINFONI data, i.e., the region to which we restricted our analysis in this paper.
Current usage metrics show cumulative count of Article Views (full-text article views including HTML views, PDF and ePub downloads, according to the available data) and Abstracts Views on Vision4Press platform.
Data correspond to usage on the plateform after 2015. The current usage metrics is available 48-96 hours after online publication and is updated daily on week days.
Initial download of the metrics may take a while.