Fig. 5
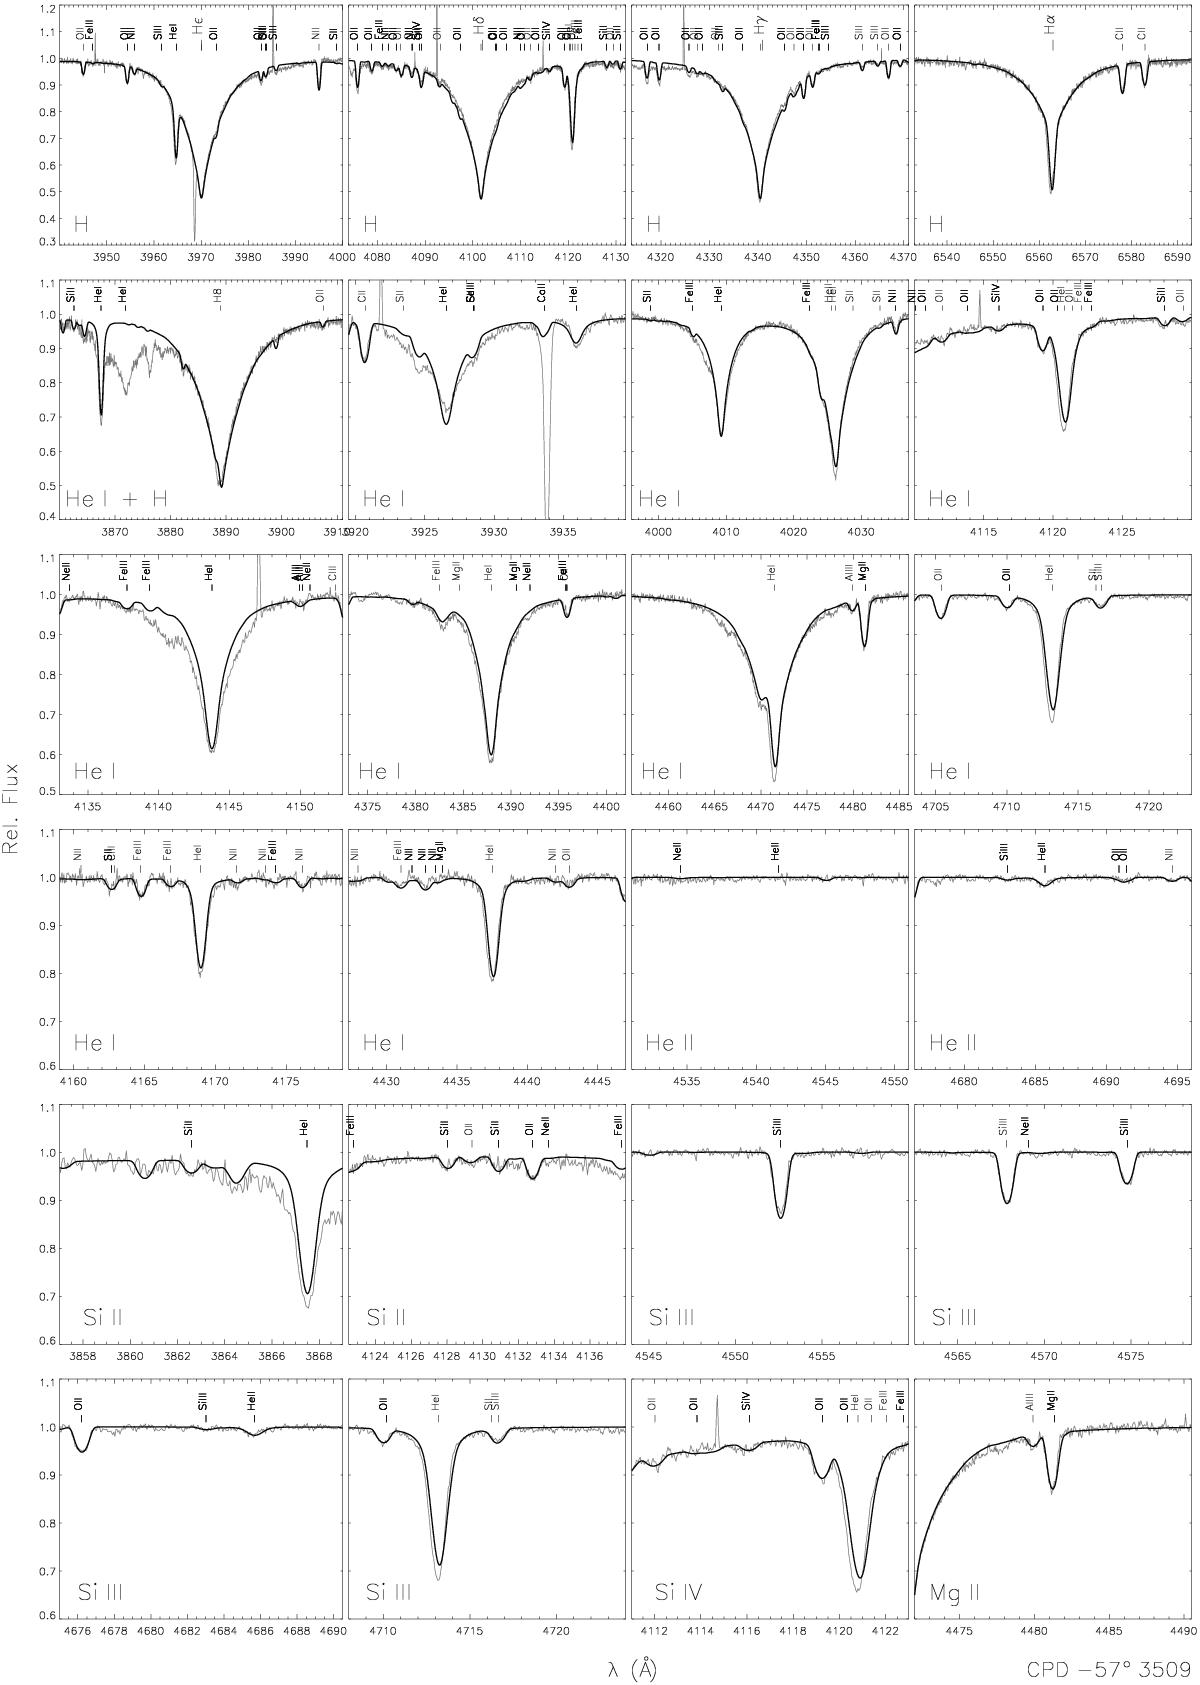
Comparison of our global best-fit model (thick black line) to the normalised FLAMES/GIRAFFE spectrum of CPD −57° 3509 (grey line), concentrating here on H, He i/ii, Si ii/iii/iv and Mg ii lines. The panels are centred on analysed lines, sorted according to chemical species (as indicated in the lower left of each panel), and, within a species, sorted along increasing wavelength. Line identifications are given.
Current usage metrics show cumulative count of Article Views (full-text article views including HTML views, PDF and ePub downloads, according to the available data) and Abstracts Views on Vision4Press platform.
Data correspond to usage on the plateform after 2015. The current usage metrics is available 48-96 hours after online publication and is updated daily on week days.
Initial download of the metrics may take a while.