Fig. 3
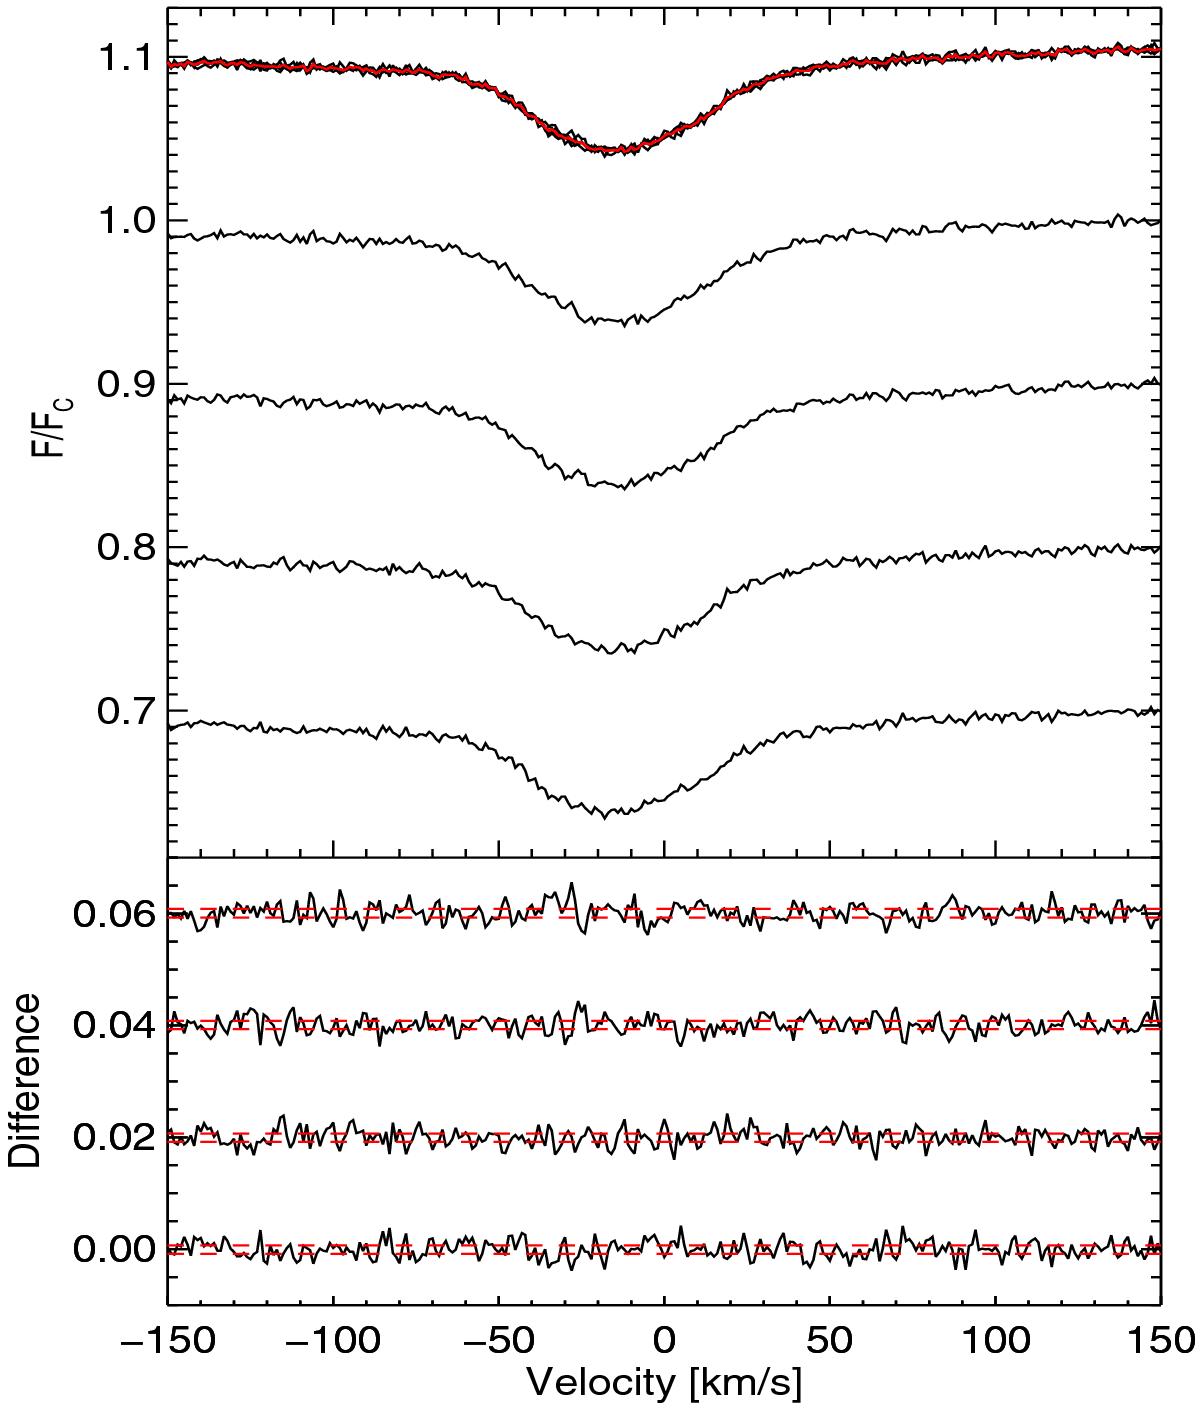
Testing for the presence of β Cephei pulsations in CPD −57° 3509 on the basis of LSD Stokes I profiles for the individual HARPS subexposures from the Potsdam reduction. The normalised average profile (in red, overlaid on all four sub-exposures in the topmost curve) and the individual subexposure profiles (subsequent curves) are shown in the upper panel, shifted by constant offsets. The lower panel shows the difference between the individual subexposures and the average profile, with the dashed lines indicating the ±1σ-ranges.
Current usage metrics show cumulative count of Article Views (full-text article views including HTML views, PDF and ePub downloads, according to the available data) and Abstracts Views on Vision4Press platform.
Data correspond to usage on the plateform after 2015. The current usage metrics is available 48-96 hours after online publication and is updated daily on week days.
Initial download of the metrics may take a while.