Fig. 2
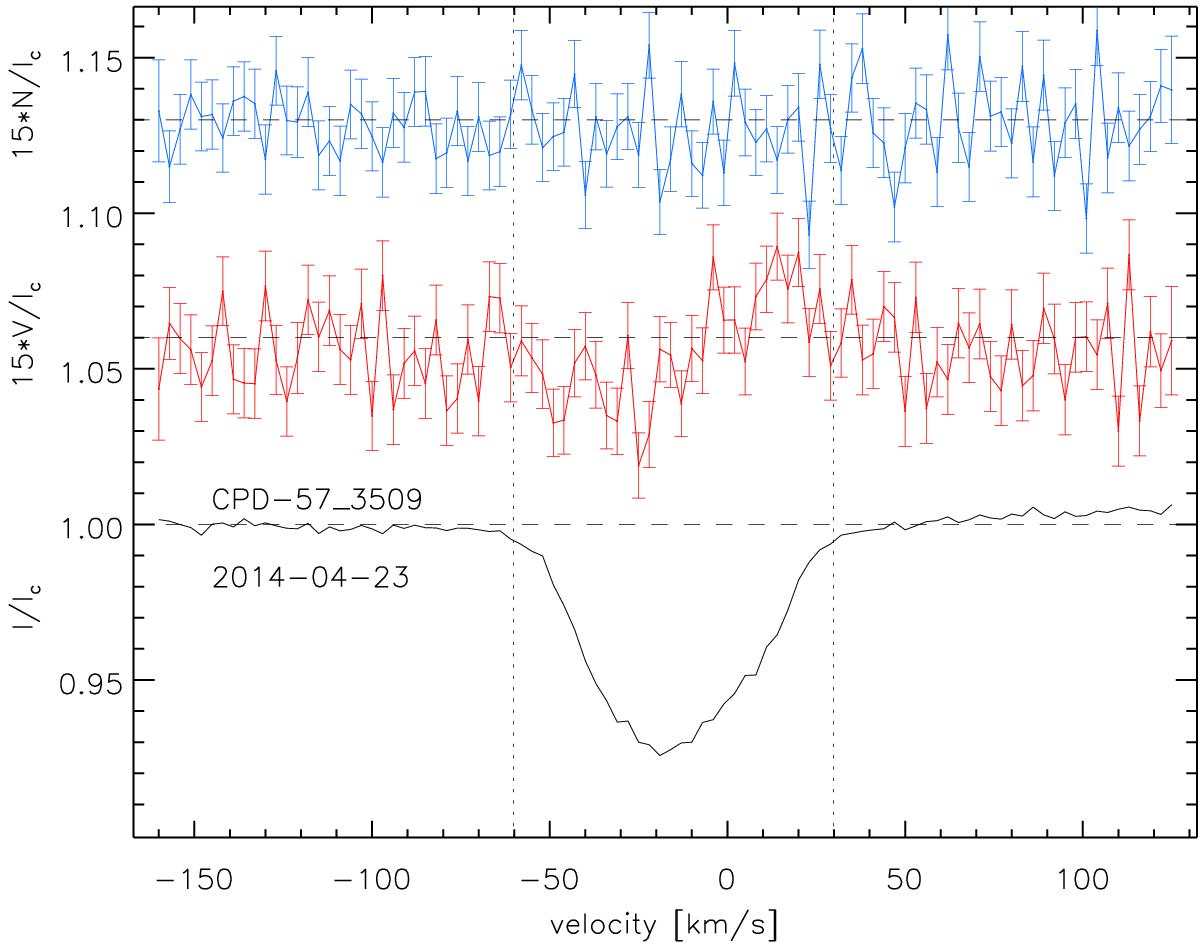
LSD profiles of Stokes I (black solid line – bottom profile), V (red solid line – middle profile), and N parameter (blue solid line – top profile) obtained for CPD −57° 3509 in the Bonn reduction. The error bars of the LSD profiles are shown for both Stokes V and the N parameter. The vertical dotted lines indicate the velocity range adopted for the determination of the detection probability and magnetic field value. All profiles have been rigidly shifted upwards/downwards using arbitrary values and the Stokes V and N profiles have been expanded 15 times.
Current usage metrics show cumulative count of Article Views (full-text article views including HTML views, PDF and ePub downloads, according to the available data) and Abstracts Views on Vision4Press platform.
Data correspond to usage on the plateform after 2015. The current usage metrics is available 48-96 hours after online publication and is updated daily on week days.
Initial download of the metrics may take a while.