Fig. 3
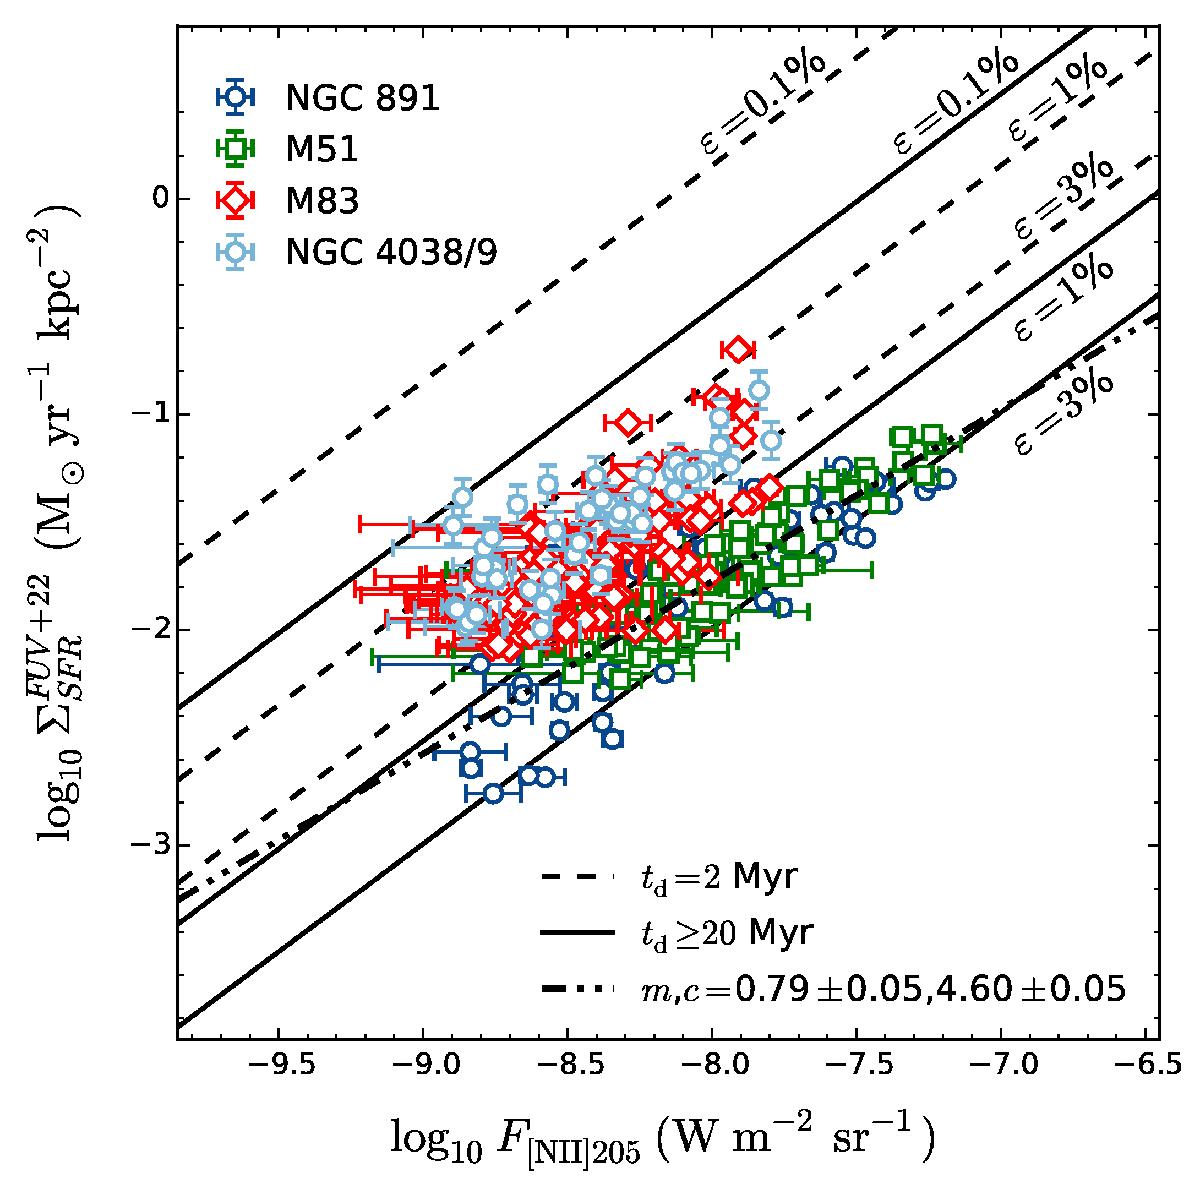
The ΣSFR – F[ NII] 205 correlation superimposed on the predictions from the Starburst99 model. For varying values of ε, the dashed lines correspond to a stellar population with a constant SFR and td = 2 Myr, and solid lines correspond to td ≥ 20 Myr. The dash-dotted line is the best-fitting linear relation from the M 51 and NGC 891 data.
Current usage metrics show cumulative count of Article Views (full-text article views including HTML views, PDF and ePub downloads, according to the available data) and Abstracts Views on Vision4Press platform.
Data correspond to usage on the plateform after 2015. The current usage metrics is available 48-96 hours after online publication and is updated daily on week days.
Initial download of the metrics may take a while.