Fig. 1
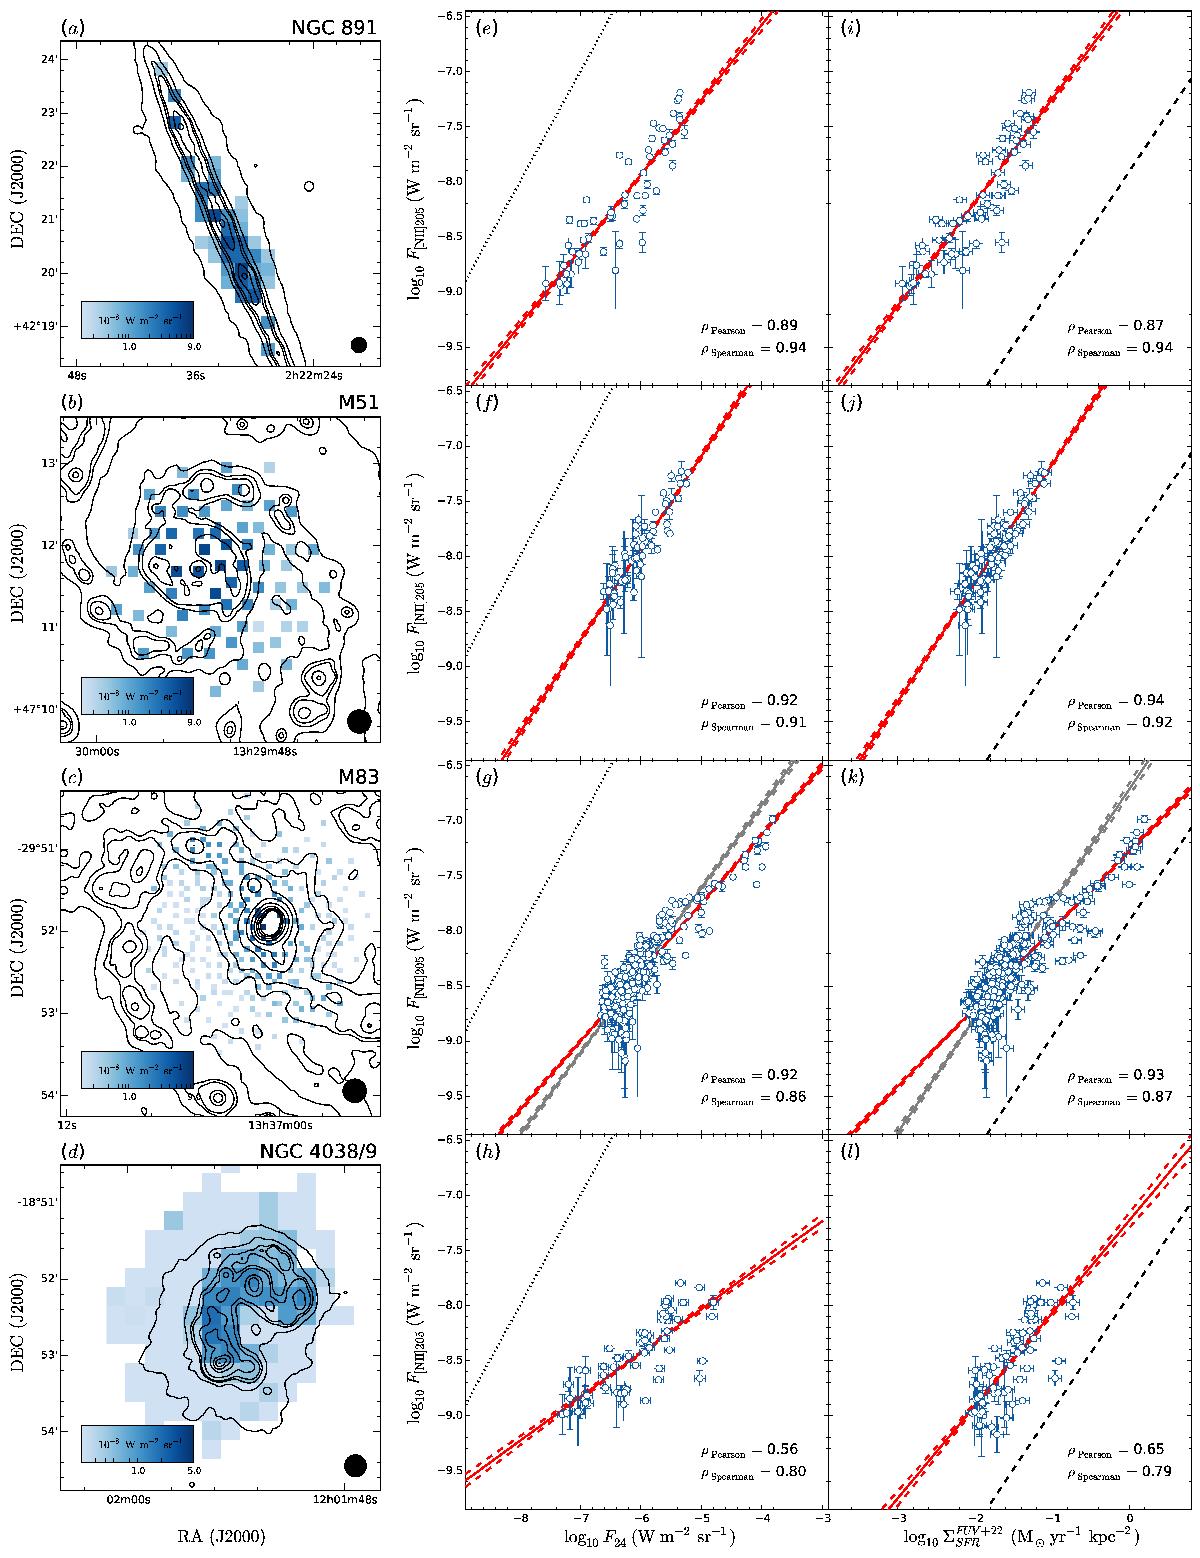
For each galaxy (rows): SPIRE FTS [Nii] 205 μm line emission maps at 17″ resolution (i.e. the beam size, indicated by a circle) superimposed on contours of constant 24 μm emission (left panels). The observed logarithms of the [Nii] 205 μm line flux density versus 24 μm continuum flux density (middle panels) and ![]() (right panels) are shown for each resolution element (blue circles). The scatter plots include the best linear fit (red solid line), 1σ confidence intervals (red dashed lines), the 1:1 relationship (dotted line), and the converted [Nii] 205-SFR relation from integrated measurements (black dashed line) found by Zhao et al. (2013). The grey lines for M 83 indicate the best fit and confidence intervals obtained when excluding central pixels (log 10F24(W m-2 sr-1) > −4.4). We state the Pearson and Spearman coefficients.
(right panels) are shown for each resolution element (blue circles). The scatter plots include the best linear fit (red solid line), 1σ confidence intervals (red dashed lines), the 1:1 relationship (dotted line), and the converted [Nii] 205-SFR relation from integrated measurements (black dashed line) found by Zhao et al. (2013). The grey lines for M 83 indicate the best fit and confidence intervals obtained when excluding central pixels (log 10F24(W m-2 sr-1) > −4.4). We state the Pearson and Spearman coefficients.
Current usage metrics show cumulative count of Article Views (full-text article views including HTML views, PDF and ePub downloads, according to the available data) and Abstracts Views on Vision4Press platform.
Data correspond to usage on the plateform after 2015. The current usage metrics is available 48-96 hours after online publication and is updated daily on week days.
Initial download of the metrics may take a while.