Fig. 8
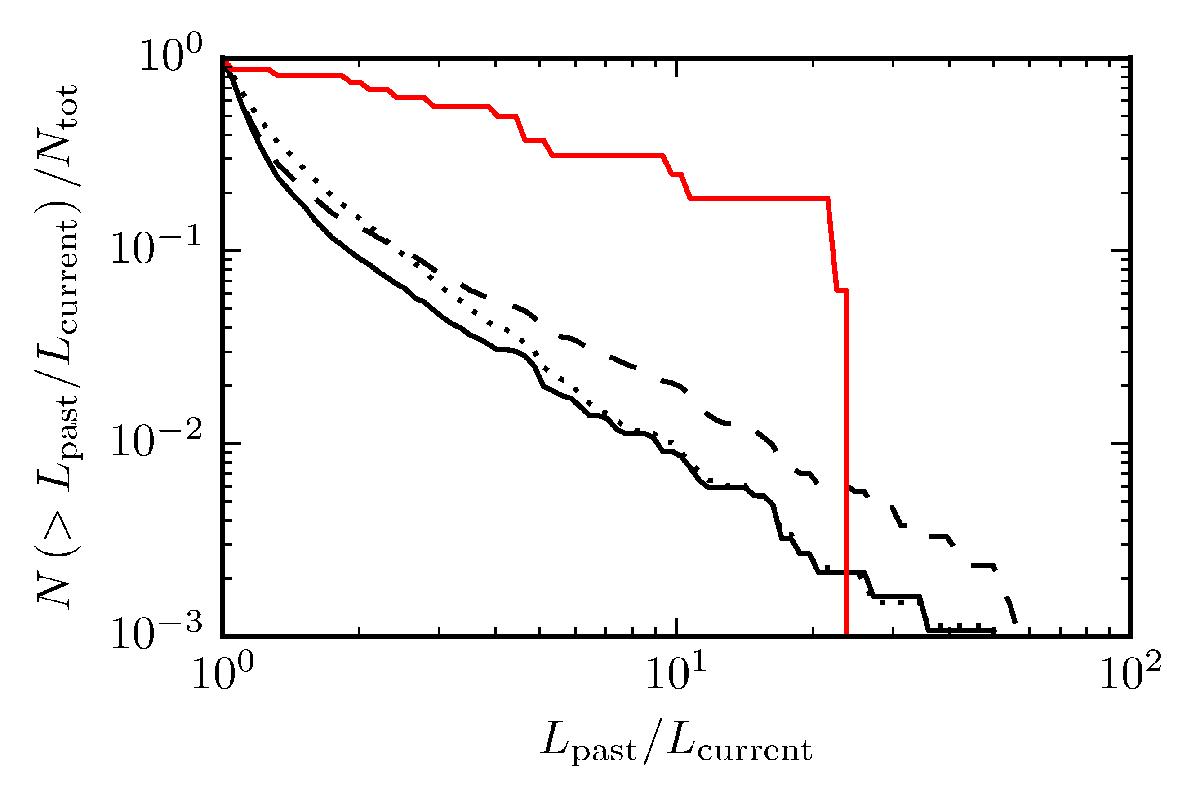
Cumulative distribution of systems in the simulation that have had their luminosity increased by at least some factor, given by the horizontal axis, in the past. The black solid line is the distribution of the sample presented in Sect. 3.1, while the red solid line is the distribution of the Jørgensen et al. (2015) observations shown in Fig. 5. The dotted line is for the same sample, but including binaries, while the dashed line include protostellar luminosities down to 0.05 L⊙. The lookback time is 10 kyr.
Current usage metrics show cumulative count of Article Views (full-text article views including HTML views, PDF and ePub downloads, according to the available data) and Abstracts Views on Vision4Press platform.
Data correspond to usage on the plateform after 2015. The current usage metrics is available 48-96 hours after online publication and is updated daily on week days.
Initial download of the metrics may take a while.