Fig. 7
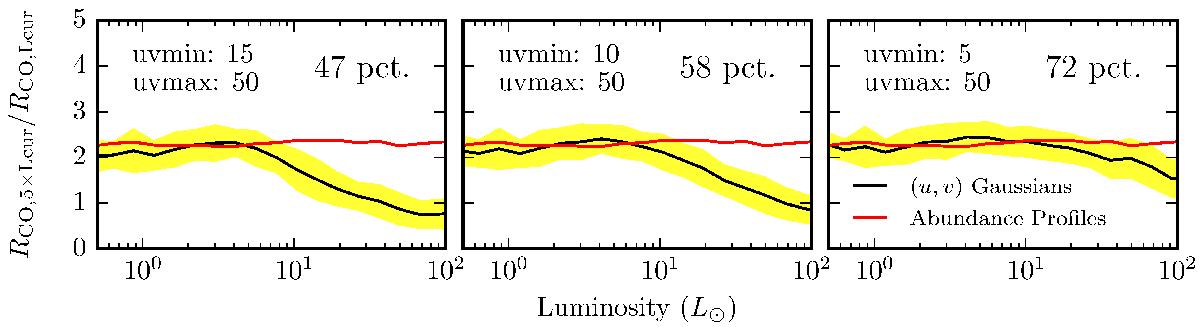
Ratios between measured extents as function of luminosity. The shaded area is the one-sigma uncertainty of the ratio measured from the (u,v)-plane. The (u,v)-range used for calculating the extent of RCO,5 × Lcur is shown in the upper left of each panel. The number in the upper right corner of each panel indicate how large a fraction of the ratios measured from the (u,v)-plane are within 20 % of the ratios measured from the abundance profiles.
Current usage metrics show cumulative count of Article Views (full-text article views including HTML views, PDF and ePub downloads, according to the available data) and Abstracts Views on Vision4Press platform.
Data correspond to usage on the plateform after 2015. The current usage metrics is available 48-96 hours after online publication and is updated daily on week days.
Initial download of the metrics may take a while.