Fig. 5
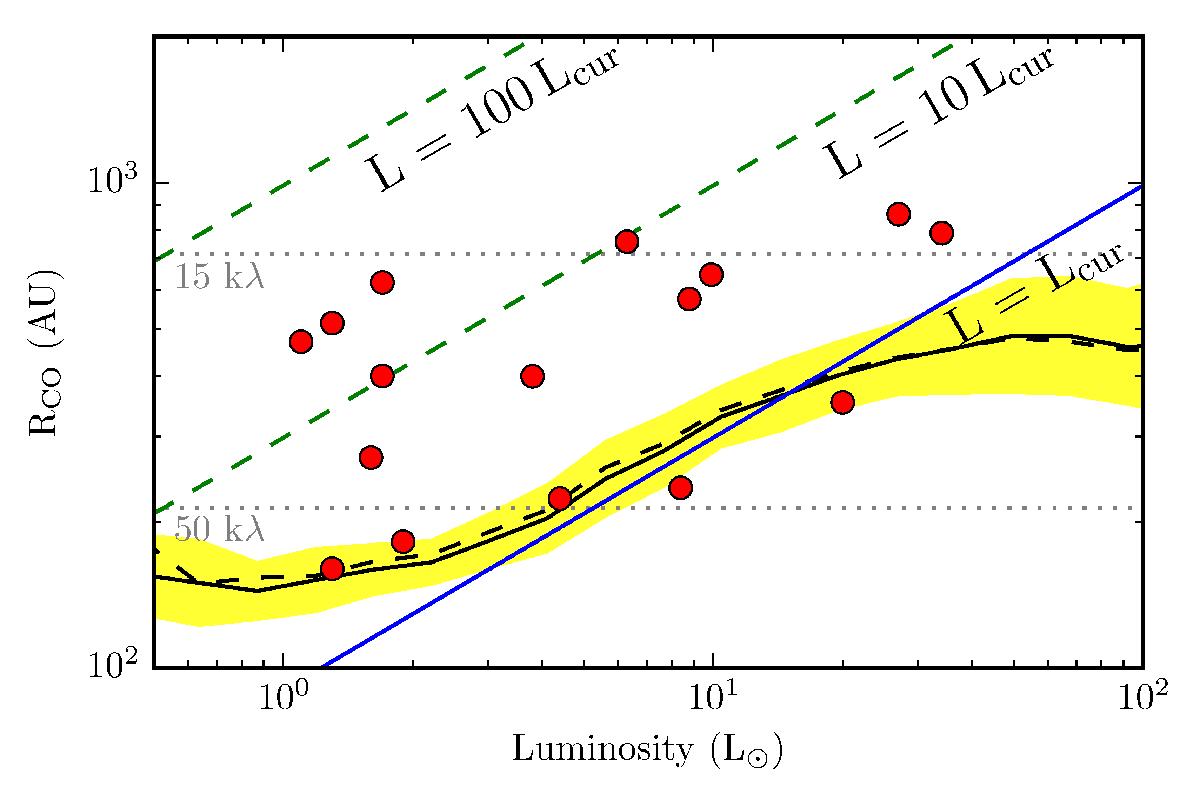
RCO vs. luminosity. The black line is the measured extent from the simulation without any history, with the shaded area giving the one-sigma uncertainty. The black dashed line is the measured extent including luminosity history. The red points are the observations from Jørgensen et al. (2015). The blue line is the predicted extent given by Eq. (4). The dotted lines show the 15 kλ and 50 kλ baseline limits, assuming a source distance of 235 pc.
Current usage metrics show cumulative count of Article Views (full-text article views including HTML views, PDF and ePub downloads, according to the available data) and Abstracts Views on Vision4Press platform.
Data correspond to usage on the plateform after 2015. The current usage metrics is available 48-96 hours after online publication and is updated daily on week days.
Initial download of the metrics may take a while.