Fig. 3
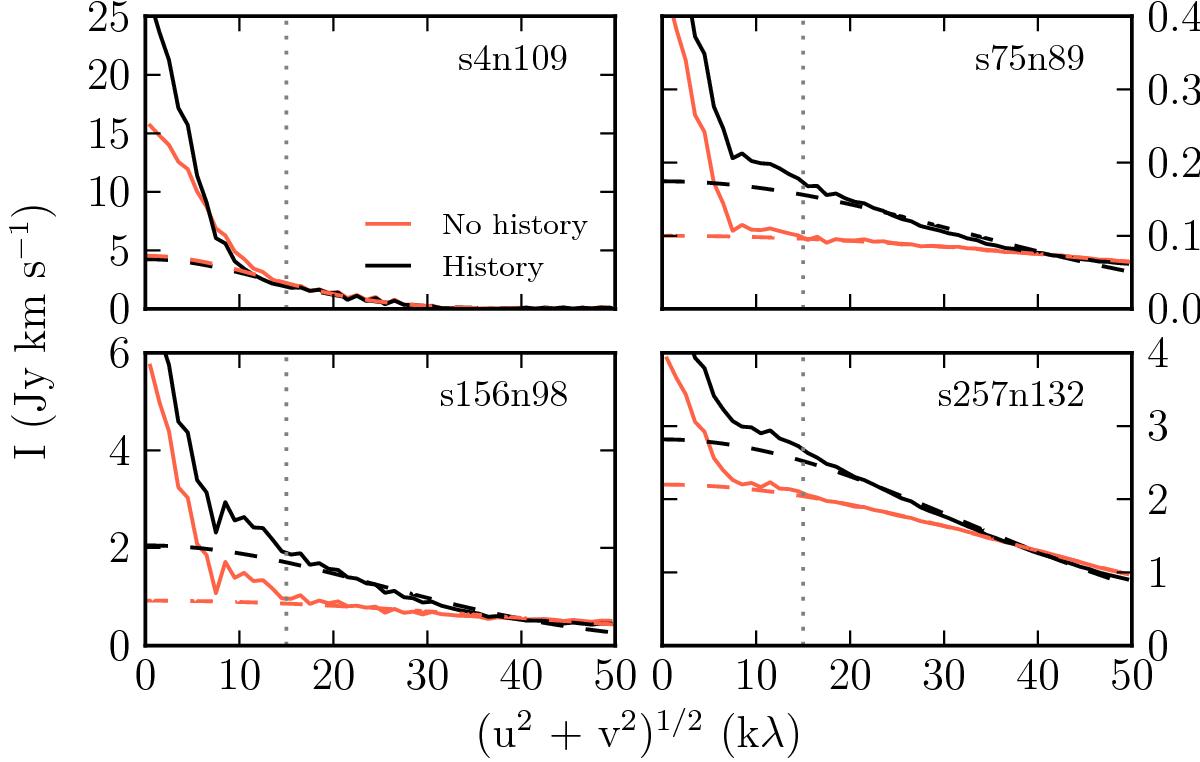
(u,v)-amplitude plots of the four objects shown in Fig. 2. As before, the black line shows the situation including luminosity history and the red line the situation without. The dashed lines show the fitted Gaussians for each situation. The dotted line show the 15 kλ lower limit imposed on the fit. The upper limit on the fit is 50 kλ.
Current usage metrics show cumulative count of Article Views (full-text article views including HTML views, PDF and ePub downloads, according to the available data) and Abstracts Views on Vision4Press platform.
Data correspond to usage on the plateform after 2015. The current usage metrics is available 48-96 hours after online publication and is updated daily on week days.
Initial download of the metrics may take a while.