Fig. 2
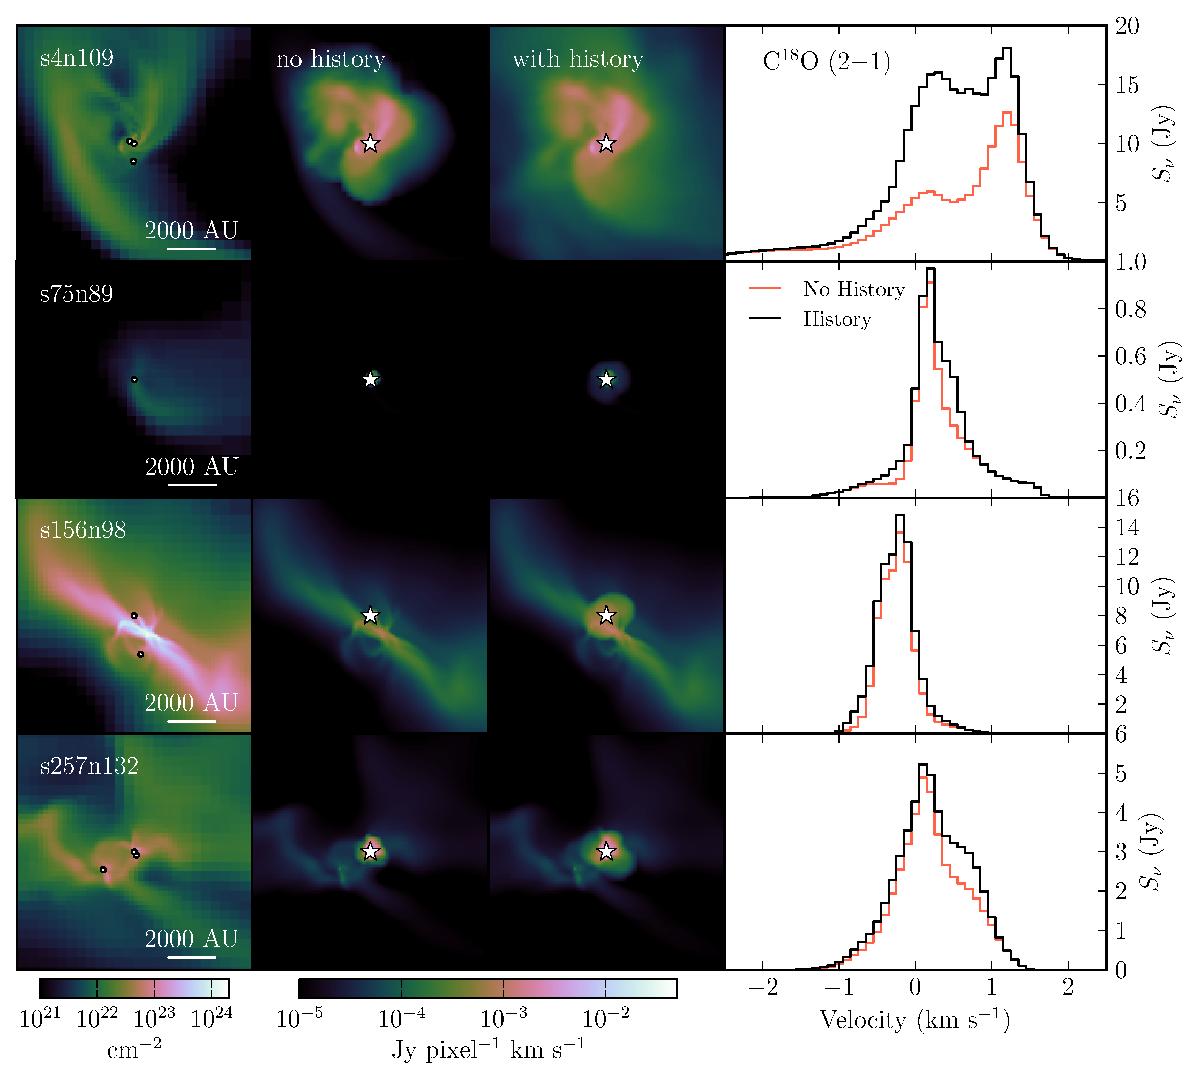
From raw simulation to synthetic observables for four different systems. From left to right: projected gas column density of the raw simulation, with dots indicating protostars; zero moment maps of the C18O 2–1 line; line spectra of the two zero moment maps. In the column labelled “no history” the C18O number densities have been calculated without taking the luminosity history of the central protostar into consideration, while, in the column labelled “history”, the luminosity history has been included. The line spectra have been calculated by integrating over the entire field of view as seen in the moment maps.
Current usage metrics show cumulative count of Article Views (full-text article views including HTML views, PDF and ePub downloads, according to the available data) and Abstracts Views on Vision4Press platform.
Data correspond to usage on the plateform after 2015. The current usage metrics is available 48-96 hours after online publication and is updated daily on week days.
Initial download of the metrics may take a while.